

I do hope I’m not getting on your wick with this 5% Canary stuff, but for me, it’s just too compelling.
Recently, I wrote about an S&P 500-based strategy that from 1994 onwards had a yearly performance of (CAGR) 12.98%.
Its basics:
Sell the S&P500 when an “Andrew Thrasher 5% Confirmed Canary” signal has been generated.
Buy when the S&P 500 is 3% above its 200-day moving average1.
Heed a minimum four-month “quiet period” between a sell signal and a buy signal.
After selling the S&P upon receiving a “Confirmed Canary” signal, buy TLT (long-term U.S. government bonds) if TLT’s price is in Golden Cross territory (50-day-moving average above its 200-dma)2.
Otherwise, go to cash.
I called this my “Benign Neglect” strategy, as it had relatively few buy/sell episodes. 8 Confirmed Canary signals in 29 years mean you’re in the market most of the time (which is generally profitable and “benign”), and at the same time you’re not losing big bucks on unnecessary transactions.
Using this strategy, you try to ignore normal 10% market fluctuations (=neglect), knowing that you’ll probably have ample time to react to the few very big crises.
In my mind, these are some pretty simple, unsophisticated rules. There is little likelihood they’re over-adapted to a particular secular investing era and little chance of data mining.
And, the strategy’s backbone — Andrew Thrasher’s work — is based on data going back 120 years. So, this is not a fly-by-night approach to investing.
I wrote about this several times: here, here, here, and here.
With leads to the question: is this applicable to other markets and indexes?
In his Dow Award-winning paper, Thrasher included several case studies of markets and indexes other than the S&P 500, including foreign stock markets (Germany’s DAX, Japan’s Nikkei) as well as e.g. the Dow Jones Industrial Average.
All cases seemed to support his main premise: Before they crash, markets tend to suffer a quick downdraft from a high (5% in 15 days), and then experience further slippage (down to the 200-day moving average) within two months.
When this happens: high alert!
(And on the contrary, if it doesn’t, you can probably buy most dips).
So my next step was obvious. I wanted to see how my particular approach to Thrasher’s principles works when applied to the strong-growth, potentially very profitable Nasdaq index.
However, I ran into a roadblock.
The problem with head-fakes
The Nasdaq is considerably more volatile than the S&P500. This caused some difficulty in implementing my Benign Neglect rules.
For instance, for a few weeks in 2008, the market thrusted upwards several months after the Confirmed Canary signal had been generated. Buy QQQ in May 2008: great idea, sport! As you probably know, shortly later it resumed sinking to the generational lows of the Great Financial Crisis.
What to do? I decided to integrate one additional simple rule:
Cancel any buy signal if is not confirmed within 2 months.
The confirmation signal is: the Nasdaq’s Golden Cross (which as stated, is when its 50-day moving average is above the 200-day.)
Hopefully, this feature is the logical consequence of investing in a volatile market and doesn’t amount to data mining.
I did not try out which variant works best — whether using 3, 4, or 6 months would improve performance. So, there was no obvious optimization involved here.
The head-fakes were still quite detrimental to performance; oftentimes, re-selling QQQ (the Nasdaq ETF) after two months came at a considerable loss.
For comparison purposes: my original Benign Neglect Strategy just sold the S&P 500 in 2008 and stayed in cash for the rest of the year. In contrast, the head fakes, even when somewhat compensated by the new two-month confirmation rule, meant that my QQQ strategy would have lost 17.29% in 2008.
(Luckily, our strategy was able to invest in TLT during 2008, according to our risk-off rule. So, the total loss for 2008 wasn’t quite so bad: -2%).
In total, the head-fakes / the 2-month confirmation rule cost the strategy almost 0.5% in total CAGR.
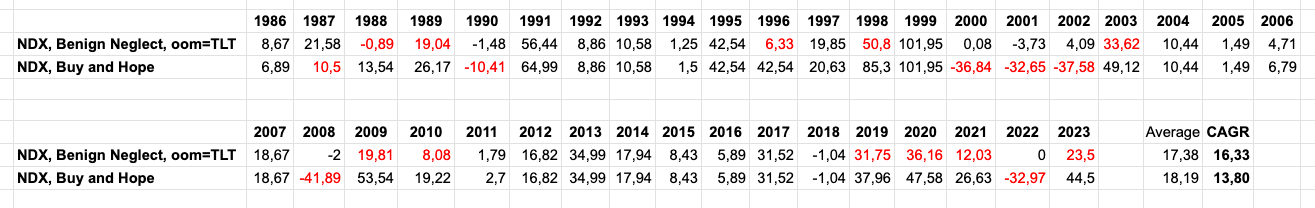
Investing in QQQ according to “Benign Neglect” rules: the results
Ta-daa! This time, I started my backtest in 1986, using Yahoo data for the NDX index. As a risk-off asset, I used VUSTX until 2003, from which the ETF TLT was investible.
In these 37 years, I note 16 Confirmed Canary sells = risk-off every 2.3 years.
This compares unfavorably to the SPX variant (8 sells in 29 years = risk-off only every 3.6 years) which however is no major surprise, in light of the Nasdaq’s much higher volatility.
So maybe I should call it “Benign Not-Quite Neglect”?
In any case, I am satisfied with the Nasdaq variant’s performance:
From 1986 to November 14, 2023 +16.33%.
(Buy and Hold: +13.8%)
For a strategy that is not overly complicated, doesn’t involve frequent trading, and has a 120-year empirical underpinning, that’s not too shabby.
The usual caveats apply. Past performance does not promise future pleasure. In particular, I don’t hope to profit from anything like what happened to the Nasdaq in 1999 (almost +102%!)
On the other hand, following 1999, the Nasdaq had a terrible triennium, with cumulative losses of over 90%.
“Benign Neglect/Nasdaq” suffered a lot less, with a total loss of less than half a percent within this span of three years.
Of further note is that this strategy ended in the red in only five years. And none of these negative years ended with double-digit losses.
Of concern is the weak net performance in 2000-2002. Investors typically abandon a strategy if it doesn’t make real money over more than two years. In contrast, the S&P variant of “Benign Neglect” never had more than two years of weak (<8% performance).
One should note however that nobody is suggesting that “Benign Neglect/Nasdaq” should be one’s only investment strategy!
For instance, a 50/50 combination of SPY/QQQ Canary approaches would go a long way in smoothening performance.
Here’s the yearly data (click to expand):
Party like it’s 1999?
What’s the current situation? In contrast to the S&P500 (as I warned in October), for months the Nasdaq hasn’t gone through anything even close to a Confirmed 5% Canary. (The last sell signal was in late 2021).
(Incidentally, a number of indexes are currently very close to what I call Canary Resets, i.e. new 52-week highs. That would include the Dow Jones Industrial Average, and the S&P 500.)
In fact, the Nasdaq yesterday (Nov. 22) hit a new 52-week high. Are we in a danger zone?
Remember, a 5% Canary is signaled whenever an index sinks 5% below a 52-week high within 15 days.
Since the last Confirmed Canary was in late 2021, and the average time from CC to CC is 2.3 years, we can expect a new crash around March next year, right?
Wrong. Sometimes, the span between signals is much longer. Like from 2012 to 2018 = 7 years!
Some observers are expecting this tech bull to go from FOMO to YOLO, with a melt-up comparable to 1999. That’d be the much-anticipated A.I. bubble (something I wrote about back in May, but never really happened).
Who knows what’s going to happen? All I can do is watch out for the next proper signal.
I’ll let subscribers know when the next 5% Nasdaq Canary has been signaled, and especially when it’s been confirmed. So be sure you’re subscribed.
In the meantime, why don’t you drop a comment in the comments sector, to let me know what you think about this investing strategy. It’d be much appreciated!
This “buy at 200-dma plus 3%” - approach was created by Bill Sadek. In previous posts, I have actually called it the “Sadek buy rule”, but this time, I forgot to attribute it properly — my apologies to Bill. He actually developed a whole, quite useful strategy which says “buy at +3%, sell at -5%) which is generally a superior alternative to for example the Golden Cross. Footnote added post-publication, November 24 2023.
What I actually do is somewhat simple/primitive. Upon selling for example on March 14, I buy TLT on April 1 if the monthly buy/sell signal for TLT is generated at that point. Here is the signal. Likewise, I sell TLT at the end of the month in which I re-buy SPY.
In your article you mentioned: "Buy when the S&P 500 is 3% above its 200-day moving average."
This reminds me of a strategy I've followed in the last 15 years: Buy when the S&P is 3% above the 200 MA, sell when it's 5% below the 200 MA. This simple strategy still works today!
Another very nice article. I’m glad you looked at it, since I’m a big fan of QQQ. Since it’s Thanksgiving weekend, and there are a lot of distractions, I may have missed in the article if you looked at buying QQQ when SPY triggers the strategy.