Two Tweaks Have Improved My Favorite 'Avoid Major Losses' Strategy
Add treasuries, get CAGR 12.98%

1) Where this is coming from
Full confession: I used to be one of those “I hate volatility” investors. So I subscribed to all kinds of strategies that intended to reduce their monthly and yearly fluctuations to a minimum. That worked very well, foremostly by adding counter-correlated assets: treasuries to stocks, for instance. 60/40 for the win! One asset went up when the other went down. And both often went up at the same time. That is, until last year, when the negative correlations vanished, as did the strategies’s low levels of volatility.
2) If you can’t prevent discomfort, embrace it
So, the premise of AML (the ‘avoid major losses’ school of finance — by the way, I just made that up) is that an investor needs to embrace some volatility/discomfort in order to make long-term gains.
First-rate investors are occasionally quite relaxed about volatility. Warren Buffett has said,
"If the investor fears price volatility, erroneously viewing it as a measure of risk, he may, ironically, end up doing some very risky things."
Here’s Warren with a slightly more technical take,
"We regard volatility as a measure of risk to be nuts.”
Do understand however, that embracing discomfort does not mean endangering one’s self / one’s financial health. A drawdown of 10% is normal, and 20% can happen once a decade, but the whole point of ‘AML’ is to prevent what happened in 2000 and in 2008 — losses of 40% and more.
3) The strategy, as you know it
A few weeks ago, I wrote about Andrew Thrasher’s “5% Canary” investing discovery. Thrasher observed that major corrections and bear markets usually begin with a strong downdraft of at least 5%, which happens within 15 days after a 52-week stockmarket high. This initial “canary in the coal mine” needs to then be confirmed by further losses which take the stock market below its 200-day moving average, within two months. Read about it here, here and here.
When these conditions (which Thrasher calls a “Confirmed 5% Canary) have been fulfilled, it indicates some serious risk to the stock market. You can then expect further losses that can range from 20% to 90%, as calculated from the original 52-week high. Just as we experienced it after the Dotcom bubble burst, or during the Great Financial Crisis of 2008.
A great advantage of this approach is that you stay invested most of the time. Over the past 30 years, the only times the 5% Canary sang its “sell everything” tune were in 1998, in 2000, in 2006, 2007, 2010, 2018, 2020, and in 2022. Eight sell signals in thirty years = only once every 3.75 years on average.
Thrasher’s 5% Canary is basically a sell signal. To create a complete strategy, I added Bill Sadek’s approach of buying when an index is at least 3% above its 200-day moving average.
The subsequent results, as per my original post of September 22: From 1998 onwards to the end of August 2023, compounded to +9.85%. This as I called it, “Benign Neglect” strategy gained less than Buy and Hold (+10.2%), but had roughly half the drawdown, and only four years that ended in the red. (B&H: 6 years). And more to the point, no Benign Neglect year ended with negative double digits (B&H: 4 double-digit negative years, sometimes as bad as -36.81%).
4) Tweak #1: add a quiet period
What I didn’t like about Benign Neglect was the potentially disproportionate amount of buy and sell signals. Confirmed 5% Canaries occur rather seldomly, but the SPY crosses 3% over its 200-day moving average quite often.
What happens if you receive a CC sell signal, after which the stock market gains 5-10%, so you subsequently re-purchase your stocks, and then you get a long and hard bear market? Such things are known to happen.
In fact, this did occur in 2007-2008: after the original sell signal in August 2007, we received a buy signal in September. Luckily, the Canary chirped again in 2008; otherwise, we would have had to endure sickening losses during the Great Financial Crisis. But two rather quick subsequent Canaries are not something on which one can rely.
So I tested this idea: after a Confirmed 5% Canary Sell, do not re-purchase the S&P 500 for at least four months, even if the stock market looks like it is firmly within bullish territory.
In some cases, for example in 2006, this had rather unfortunate results. During that year, stock prices sank for several weeks in May, but this episode was over by June. But according to the “quiet period” rule, we couldn’t purchase stocks until October, and missed weeks of very good market returns. Our strategy fared much worse than Buy and Hold: 5.33% versus 15.85% for the year.
The net effect of the quiet period tweak however is acceptable. Because we were able to omit several unproductive episodes of re-buying, CAGR has only deteriorated to 9.61%. At the same time, we now have only three years that ended in the red, with none worse than 2022 (-7.47%), and the two other negative years being quite harmless (-3.18% and 0.83% for the years 2000 and 2018, respectively).
But what really matters to me is that this tweak makes the Benign Neglect approach more logical and sustainable.
5) Tweak #2: Adding Treasuries to the Game
There is no good reason I know of to stay in cash for years on end during a bear market in stocks. Switching to a negatively-correlated asset such as treasuries or gold just has too much potential. (In fact, if you were an investor in Japan from 1988 to 2014, you’d actually need to switch from stocks to bonds in order to make any serious money at all.)
So here’s the rule: when SPY is risk-off, buy TLT (long-term government bonds) if TLT is in golden cross territory. Go to cash when both TLT is under the golden cross, and SPY is not a buy.
(Golden cross = the intersection of the 50-day and the 200-day moving average).
Here’s the super-simple algorithm, courtesy of Portfoliovisualizer. Looking back to 1994 (before 2003 by the way we use TLT’s proxy VUSTX), we see some bear markets in which TLT was not a buy (2022), and we see a negative episode (2020, -0.22%), some OK performance (like during the GFC, +7.46%), but also some really outstanding results (from 2000-2003: +35,59%). Which explains why this tweak adds almost 2% to our CAGR.
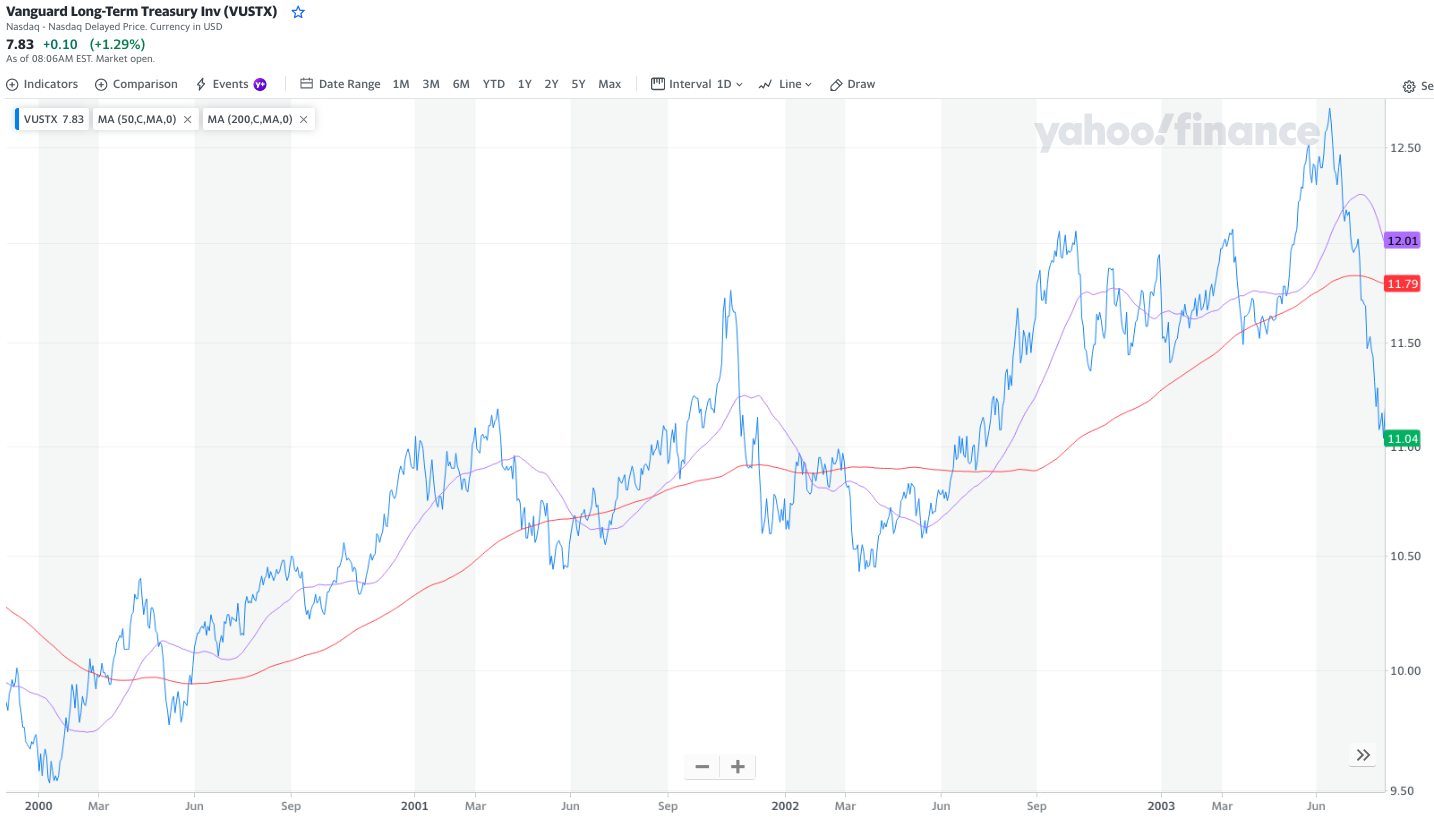
Just as an illustration, here’s how treasuries/VUSTX did during the three years following the Dotcom crash:
From 1994 until end-October 2023, we now have a CAGR of +12.98%, which compares favorably with Buying and Holding SPY (+9.91%) and Golden Cross/Death Cross investing (+10.08%). Here’s the (clickable) yearly data:

Again, in almost 30 years, only three end up with negative results, none worse than last year’s -7.47%.
6) Where are we right now?
We’ve been invested in the S&P500 since late January, for a current gain of about 9% (as of November 8).
However, as previously published, we received what I call a ‘not-quite-Confirmed 5% Canary’ signal on October 23. (The initial downdraft was limited to -4.8%, and it took two days longer than the prescribed 42 days to breach the 200-day moving average, thus ‘not quite’).
As the details of investing strategies are not written in stone, this is concerning.
It is the hallmark of good strategies that they still function under slightly different conditions. For instance, if you get good results from selling your asset at the 200-day moving average, you should also profit from selling at the 205-day line. Anything else would probably be the result of data mining.
On the other hand, admittedly, the 5% Canary has had a number of false positive signals. In 1998, in 2006, 2018/19, and in 2020, you’d have been better off with just holding stocks. So it’s not just our not knowing whether this is a real signal — we also don’t know whether it would be a useful signal if it was real.
You may think (as I do) that we received this risk-off alarm because of bad seasonality (statistically, it was the worst week of the year!) Not to mention the market weakness caused by the Israel-Hamas war. On the other hand, the initial 4.8% downdraft was probably caused by interest rates worries, which are not exactly going away.
The next 52-week high will be at SPX 4589. Or, after July 31, 2024.
In the mean time, I’d monitor other sell signals closely. For instance, a Death Cross (which is the opposite of the Golden Cross) usually follows a Confirmed Canary signal after a few weeks, sometimes even after a few months. This tardiness is not normally catastrophic (although it had seriously negative repercussions once, in 2020).
The 5% Canary bell rang in March 2000, but it took 12 months for the S&P 500 to drawdown 20%. It was 13 months from the sell signal of August 2007 to a 20% drawdown. All other episodes were shorter, and much less serious.
The problem with the Golden/Death Cross is that it occurs too darned often. Too many false positive sell signals are detrimental to financial performance. But in our current situation, as we have a pending almost-but-not-quite 5% Canary sell signal hovering over us, I’d follow the inferior, more easily excitable Death Cross signal, if it so happened.
How do you like this improved, tweaked timing system? Are you still invested in the stock market? If so, what will lead you to sell? Let me know in the comments section, please!
You mentioned that you back tested tweaks with PV. Can you please post PV link. Thanks
Nice tweaks. I really like your "quiet period". And I like your "treasuries or cash" algo.