A Warning
This might be tantamount to a Confirmed 5% Canary, after all.

My kind readers will have noticed that in the past weeks I published two pieces in reference to Andrew Thrasher’s theory of the 5% Canary.
To recap: serious bear markets reliably ring in with a quick 5% downward movement after a one-year high. And things get ominous — and this is the “confirmed” canary in the coal mine — when within two months after the first signal, markets close under their 200-day moving average, twice.
I was happy to see that the markets never quite rang the 5% bell in time, and again, that the two months went by without serious incident. So, I interpreted this as an “all clear”.
However, these values are not written in stone. A robust investment strategy also works when your levels are not exactly met.
What we got in August was a dip of 4.8%; and we have now breached the 200-day moving average in two months and four days. Which led for example Mark Ungewitter to post:
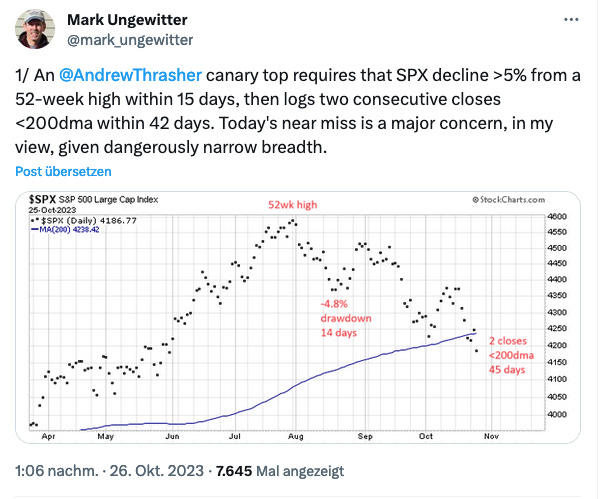
So on the negative side of the ledger, we have a near-Confirmed-Canary in what has been a quite weak market for weeks.
The ledger does have some positive sides: this week is historically the weakest of the year; up to now, the markets are showing quite normal patterns for October.
And a recession — which is the serious bull market killer — is nowhere to be seen.
Also, the tape may well be negatively influenced by a war (in Palestine and Israel) that has little economic or geopolitical weight. “Buy when the cannons are firing”, is a time-tested rule.
To be honest, I don’t know how to react.
The Bollinger Band approach
Apart from the 5% Canary, I was planning to write about another approach to investing that involves selling very seldomly — only when things are really going to pot. To provide another perspective to this unhappy market, I am pulling this forward.
This approach is even more reticent than the 5% Canary, and uses a simple rule: sell when the monthly S&P500 is below its Bollinger Bands (set to a period of 50, 6 standard deviations).
(I want to make this one quick, so I won’t explain what Bollinger Bands are today).
In effect, looking back to 1985, this meant selling in 2001, 2008, 2011, and perhaps in 2020. The trigger point in this chart is at the dotted line.
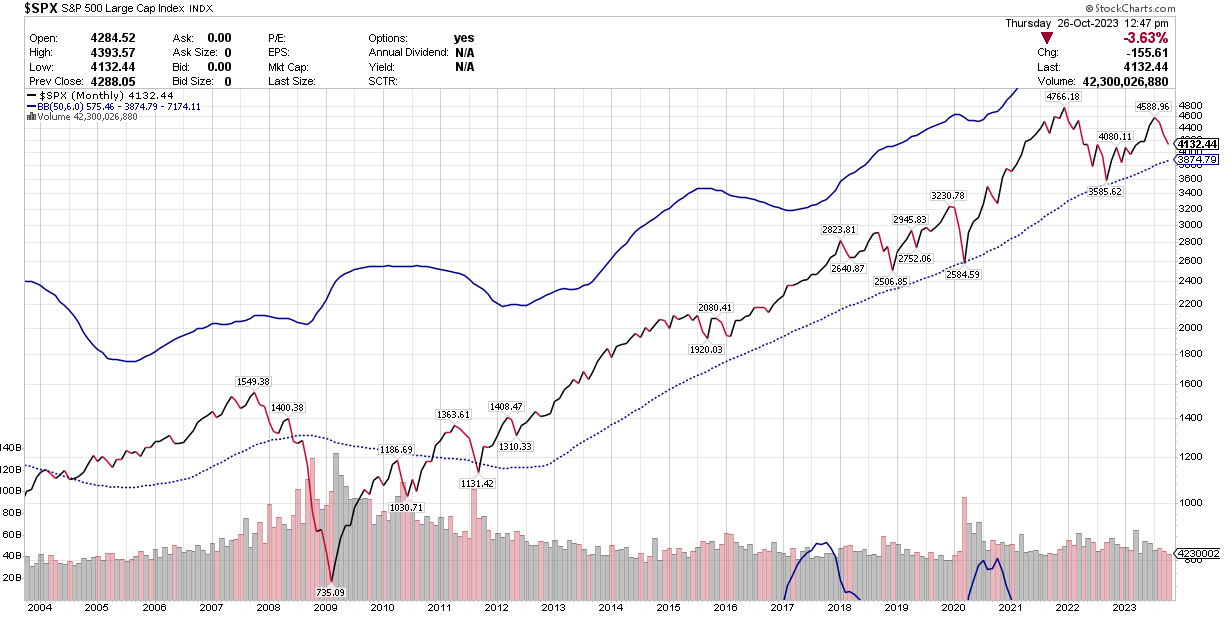
You can see that as of today, according to this system, we are not close to that sell trigger.
Positives:
You are in the market most of the time, yet you forgo the massive, >40% drawdowns of 2001-2002 and 2008.
I tested this with a simple rule: sell when the S&P500 breaches the dotted line. Buy when the S&P500 is 3% above its 200-day moving average (Bill Sadek’s rule). Results since 1998: +9.26% compounded. This compares negatively to buy & hold (10.22%), but approximately halves maximum drawdown (previously over 50%).
Negatives:
Using this strategy, you didn’t sell in 2022. -18.17%, yikes! That’s a lot worse than using the Golden Cross (-6.65%), or my “Benign Neglect” system which is based on the 5% Canary (-9.32%).
There was a short period at the end of March 2020 when the Bollinger Band was breached, indicating a sell. However, by that time, the markets were already moving up from the mid-March low very strongly, so one can assume that an astute investor would not have sold everything. (However, if one had sold upon the Bollinger Band breach, results for 2020 would have deteriorated considerably, from +18.37% to +2.43%, knocking down long-term compounded results by another half percent).
So, there we have it. Long-term Bollinger Bands do not indicate risk-off. The Golden Cross also does not at this time tell us to sell this market. Yet, the 5% Canary — which, like every timing model, has provided some bad signals — is probably (?) telling us to sell.
(Addendum October 29: of note may be that the 5% Canary is quite often a very early signal, sometimes early by more than six months. For instance, it rang the sell bell in 2007, well before the 2008 crash. 2020 was an outlier though and the February ‘20 signal was extremely timely. Thus, maybe there is no hurry in following this perhaps-signal? Wait until it is confirmed by the Golden Cross, or by Sadek? Who knows. Please don’t read these words as an invitation to procrastinate!)
The economy is running on full steam, yet inflation is high, and bonds are so expensive that many folks will just prefer to collect their 5% for owning treasuries than taking on the risk of stocks. What to do? Let me know what you think in the comments, please.
(Addendum December 1: yesterday, the SPY ended at a new 52-week high. Basically, this means the previous not-quite Confirmed Canary can be considered cancelled.
However, let’s take a look at the 2007 example: a CC was signalled August 15. We got a non-actionable, because within “quiet period” Sadek “buy” signal a few weeks later. Four months later — at the end of the “quiet time” — Sadek no longer signalled “buy”. If we treat the present time analogue to 2007, then our present quiet time would be over on February 26, 2024. We could then re-buy the SPY at that date, if it were 3% above its 200-day moving average.
Tricky, complicated stuff! But I’m going to be open here. Did I sell end-October, based on a not-quite-confirmed Canary signal? Nope. Will I wait until end-February to buy? Nah.)