
Some Late-Summer Indicators, Charts and Random Musings
Some Late-Summer Indicators, Charts and Random Musings
Let's get on the same page...

Hi everybody! I’ve written about a number of indicators over the past months; here are some updates.
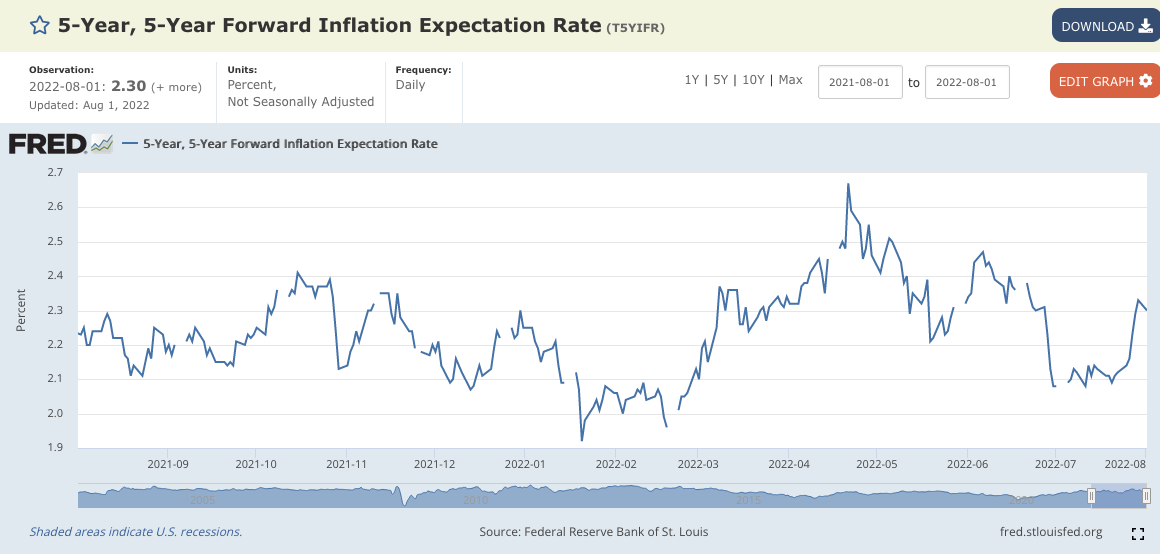
1) 5-Year Inflation Expectations
are not looking good — yikes. They spiked last week, and are now no longer in the “safe” area I described here. Be careful with those bonds!
2) The Baltic Dry Index
is likewise not in a good place. This signal (as I wrote about here) has been risk-off for most of the year, except for a quick few weeks in May, during which it would have earned you a quick 3.69%.
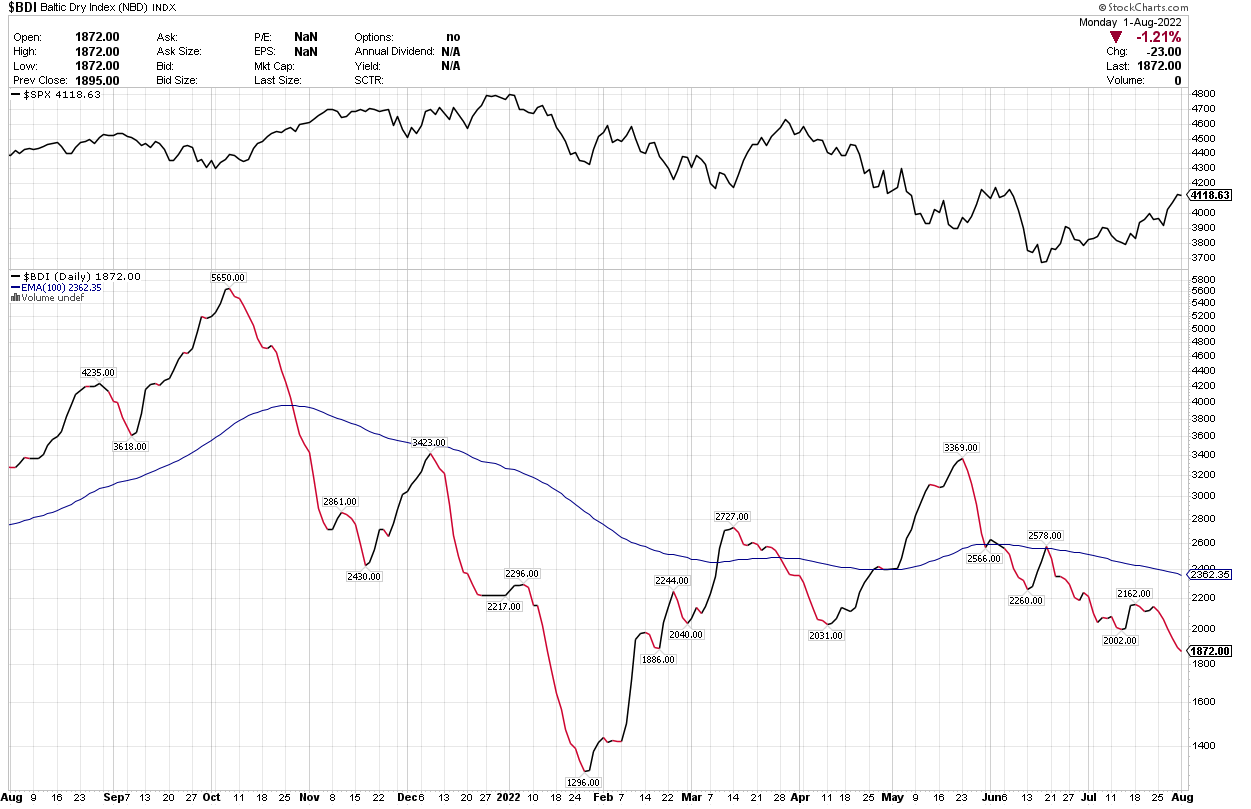
As you can see, the BDI signal is not useful for identifying bear market rallyes.
(And if this bear market rallye should now turn into a new bull, then I’ll have to do some thinking about this signal. But until then, please remain cautious).
3) Long-Term Sentiment
We’re perhaps around halfway there:

As I posited in March, from a historical perspective, at end-2021 sentiment was practically ridiculously exuberant. And exuberance dies hard — it take months to smoke out crazy optimism to the point where a new Bull can be born.
Back in March, our long-term moving average was at around 50; now we are at 56. If this trend continues, by year-end we’ll reach approximately 60: this is a reading at which a new Bull is at least conceivable (if not strongly likely). Please keep in mind that other turnaround readings in the past were between 65 and 78.
4) Moving averages
The 50-day moving average is starting to slant upwards, which we haven’t seen since March. Nice.
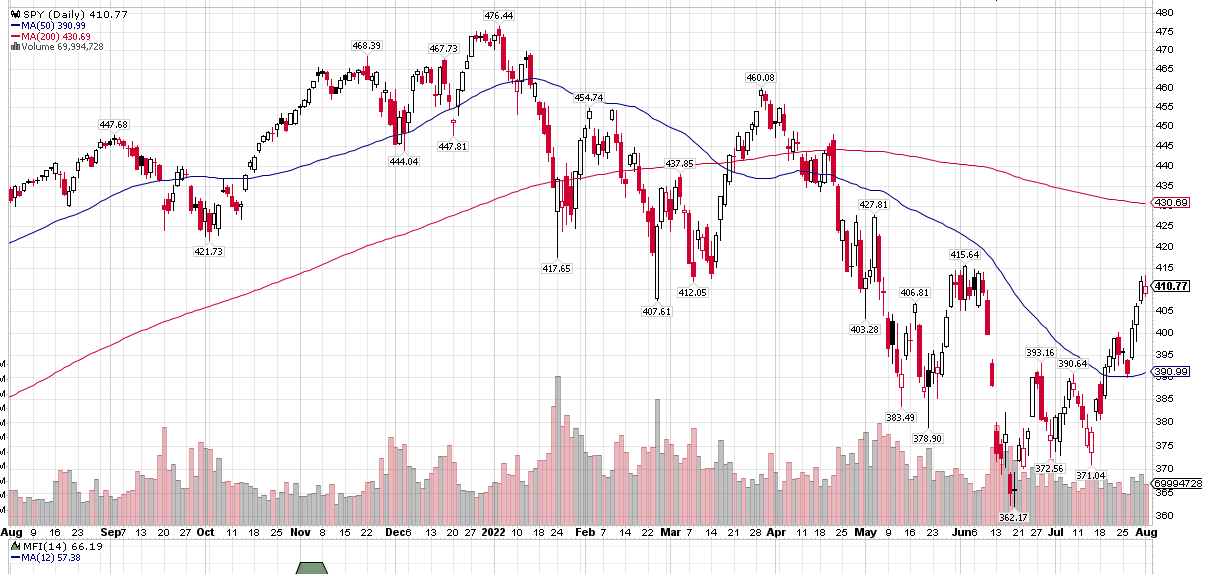
Looking at the five-year chart however, we see there is still a lot of work to do before this market looks in any way healthy. No Golden Cross in sight!

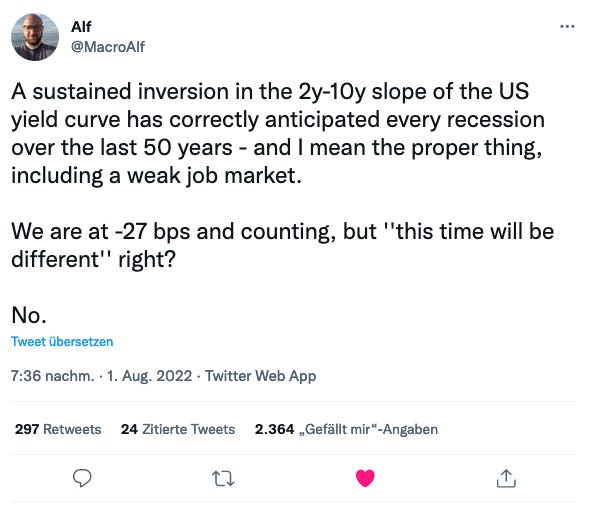
5) Recessions
are bull-market killers. Are we in a recession yet? The Economist says it’s too early to say, which is an important question, because the later it is called, the later we can hope to get out of the present Bear Market.
Once again, I recommend listening to what Macro Alf says:
In sum,
things still aren’t at all looking positive, and I haven’t even mentioned Europe. In every bear market, there are some fabulously optimistic folks who manage to be the very first to see the light on the horizon, but today, it’s not gonna be me.
Is it gonna be you? If so, let us know in the comments, please!
Hi, Martin. I try to keep my stock and bond allocations between a rough minimum and maximum.
Half in cash and half in stocks and bonds helped limit drawdowns for me this year, but I have moved above my minimum allocations over the last few weeks. So in terms of confirmation bias, I'm about equally looking for indicators to justify my still high (~30%) cash allocation and my recent less bearish portfolio stance.
I see that you included one positive indicator (moving averages turning up) along with your four negative indicators, so I see you judge risks along a continuum, too. I know I don't have the skill to make good "all in" or "all out" calls, so I just try to scale my bets to the opportunity set.
Among the bullish indicators you might have overlooked are:
1) Declining realized (no chart) and implied volatility: https://stockcharts.com/h-sc/ui?s=$VIX
2) Improving market breadth. Bill Sadek posted this link a while ago in an SA comment, and I saved it: https://stockcharts.com/h-sc/ui?s=$NYA200R&p=D&yr=15&mn=0&dy=0&id=p98987782924&a=450936898&listNum=93&inf_contact_key=5c9489ea5d53a92695eabe5af368d0ca680f8914173f9191b1c0223e68310bb1
He also started a thread on Cliff Smith's blog describing how he uses those signals: https://cliff-smith-blog.freeforums.net/thread/11/handful-leading-market-indicators
3) The Sahm rule is considered a decent real-time recession indicator, looking for rises in unemployment. It is not indicating a recession: https://fred.stlouisfed.org/series/SAHMREALTIME
I'm not sure how timely or useful yield curve inversions are.
So short term trend, breadth and volatility are all decent market timing signals and are looking up. I can't guarantee it's not a bull trap. The strategy I posted the other day with FALN and UUP, https://bit.ly/3SzzAVe, has decent gains about 2/3 of the time when FALN is selected, and has small losses the other 1/3 of the time. So it's got a good risk/reward ratio, and is up over 2.6% since the signal turned positive two weeks ago. A look at treasury rates and credit spreads also underscores that based on valuations, the long term outlook for credit bonds is better than it has been in years.
P.S., I still have the Baltic Dry Index data loaded into PV as a backfill to BDRY. The CAGR of trading "at signal" is about 11%, vs 13.7% for buy and hold -- but it does improve drawdown and Sharpe ratio. Switching to a weekly trading frequency cuts the timing periods from 80 to 48, and boosts the CAGR to about 12. Since 2013, it is in cash 267 weeks and SPY only 234 weeks. So probably a good timing signal for going "risk on" and overly cautious about going "risk off."