
Financial Apocalypse Watch 1): Bowley's Waves of Sentiment
Financial Apocalypse Watch 1): Bowley's Waves of Sentiment
Looking at an indicator that says "much more trouble ahead"

This is the first of several posts that will examine and discuss various forecasts that some authors have recently published, in which they imply or even say quite outright that “the end is near!”
My intention is neither to debunk anything, nor to ring the bell for an upcoming catastrophy. All I want to do is take a good look, discuss the pros and cons, and then put a time stamp on it. (Despite the Internet being the place where anything embarassing you have ever said never goes away, perma-bears have gotten pretty good at hiding their false alarms.)
I’ll be updating this on a monthly basis, to let you know whether new data proves or disproves anything stated here.
So, on to our first harbinger of calamity:
Are you Ready for a Market Meltdown Coming?, by Tom Bowley.
Some good news first: the author posits were are in a secular bull market, in other words, still riding the wave of economic expansion that began in 2009. But within this long term bull, he sees a cyclical bear market that began in early January. And this is a bear that will roar: his target, all things being equal, is for the S&P 500 to be at 3500 or lower, in other words around 20% below today’s level (March 4, 2022).
This forecast is based on sentiment readings provided by the equity-only put/call ratio of the CBOE. Sentiment is a counter-indicator. When market participants are too exuberant, in this case measured by how many calls are being bought in comparison to puts, it often means that the market is headed for a fall.
Normally, sentiment is a short-term indicator that tells you how overbought or oversold a market is. You wouldn’t use it to read longer-term trends. But in his article, Bowley uses a long moving average of sentiment readings. So what we are basically looking at are long waves of sentiment.
When collective investor psychology has reached the very lowest levels of a long-term downward wave, when fear is strongest such as it was in 2009, this heralds the start of a new, multi-year bull market.
The opposite also applies. When investors have gotten to the level where they take easy gains for granted, when they feel no fear whatsoever, then that is when the warning bells should be tolling.
So far, so bad. Where this theory really gets spicy is when you look at the relative levels of exuberance. According to this chart, in late 2021 we got so extremely trippy (in his words, “ridiculously bullish”), that the withdrawal low will be tantamount to a very, very hard landing.
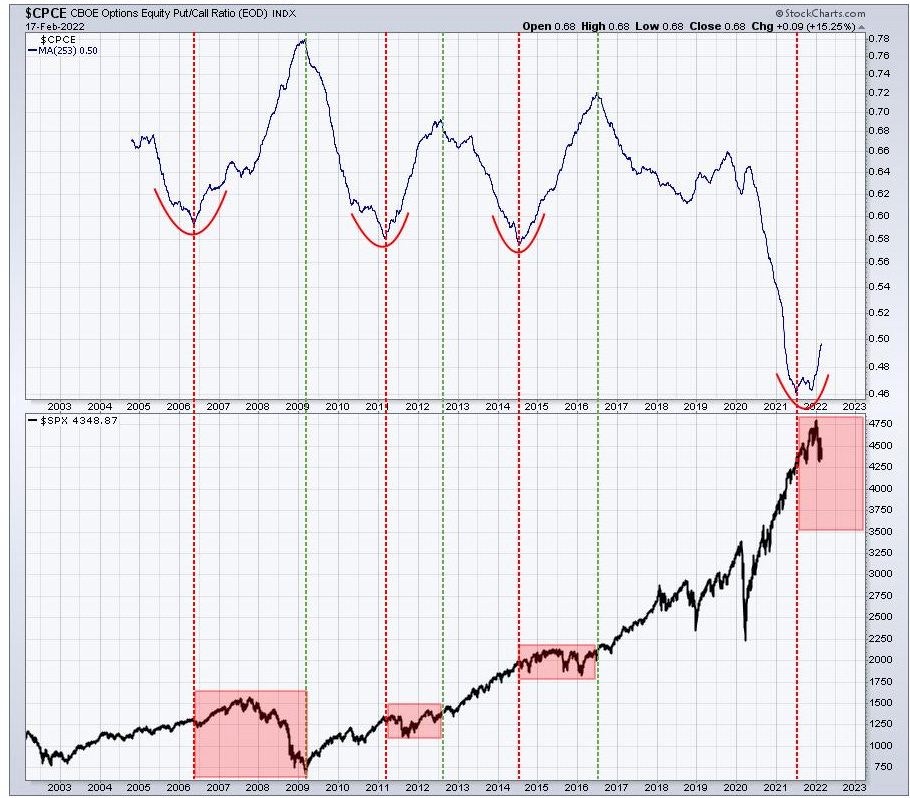
The red dotted lines indicate an inflection point, where sentiment got too positive. In such times, people are mortgaging their houses to buy theme stocks, bitcoin, and what not, which sooner or later goes to pot when there are no buyers left, after which the trend turns negative.
The green lines are the opposite: here, sentiment has gotten so negative, that every last wobbly market participant has given up the ghost, and has sold his assets in disgust. (In Germany, we rather ornately say, “der Markt hat sich ausgekotzt”, meaning: all the bad stuff has now been puked out).
Inflection points where the market turned negative: 2006, 2011, late 2014, late 2021.
Inflection points where the market turned positive: 2009, 2012, 2016.
Which leads to my first point of contention.
Some assessments and points of contention:
* The author himself admits that the negative, red-highlighted “risk-off” periods are not necessarily very dangerous; he sometimes merely calls them “choppy”. However, choppy markets like 2006 and 2011 weren’t necessarily unprofitable ones; several of the strategies I use made good money in both of those years.
* So actually, in the above chart, of the four periods that are highlighted red, two are rather harmless, and only one (2007-2009) was really destructive. (The jury is still out on the present “red alert” period).
* Likewise and contrarily, “risk-on” periods include extremely stressful times such as March 2020. The author’s explanation:
The pandemic-driven cyclical bear market in 2020 was a health care crisis, not a financial crisis. I wrote about it throughout the pandemic and boldly predicted in the middle of it that we remained in a secular (long-term) bull market. The 2020 bear market lasted 23 trading days. It was brutal, but it was swift.
In other words… sentiment didn’t matter, because that time, it was different.
*N=7! In other words, what the author calls “an extremely solid predictor of investor behavior and market performance ahead” has proven its mettle seven times in twenty years. Of which, as I say above, in several cases it wasn’t really so useful or reliable.
* Meaning: it may be nit-picking, but the author’s sentiment moving average is certainly not a precise signal. It went risk-on in mid-2016, yet the market had turned positive around five months earlier.
* And what’s the deal with the 253-day moving average? Any moving average that is not an even number sounds in my ears like curve-fitting.
* The author uses but one of many sentiment indicators that are out there. Just a few days ago, Cam Hui wrote:
Short-term sentiment models look stretched to the downside, which is contrarian bullish. The bull-bear spread from the AAII weekly survey is at levels that have seen short-term bounces. Readings have only been exceeded to the downside during the GFC and the bear market of 1990. Similar readings were seen during the bear market low in 2002. Investors weren’t even as panicked during the Crash of 1987.
That said, I suppose there is a major epistemological difference between one short-term sentiment indicator, and another one’s long-term moving average.
So where are we today?
It is in the nature of long moving averages that they… move slowly. The above chart shows the moving average at about 49; today (March 4) we are at 50. If history is a guide, we need to reach at least 66 before the light turns green.
In the past 20 years, 18 months was the minimum duration of a “risk-off” episode. According to this, we’d need to wait until 2023 to be able to travel downhill and in shadows again.
We end up with the usual cop-out: the data is inconclusive, and time will tell.
It takes time to wash the last amateur investors out of the market. In a bear market, only after they are done selling will the market be ready to turn.
Sentiment is not everything; ultimately, the markets needs good economic news. This is something the author supports, and which leads to his game plan:
I see inflation peaking over the next 2-3 months. The problem right now, though, isn't inflation; it's the Federal Reserve ready to ramp up interest rates to fight the ghost of inflation. By the time the Fed realizes they don't need to hike rates any further, the damage will be done and all the talk will shift to the "R" word -- recession.
Growth stocks will flourish. Just after the stock market has been pummeled and the shift towards a more accommodative Fed takes place, the next recession will be talked about over and over and over. But with inflation dropping and the potential of interest rate decreases on the horizon, growth stocks will suddenly surge. I hope you're ready. I know I will be.
What is your game plan? Do you use sentiment indicators? Will you be holding back until you see firm confirmation that the noobs have thrown in the towel? Let me know in the comments.