Yes, You Can Use the Baltic Dry Index
Just understand its limitations.

The Baltic Dry Index is actually a quite impressive economic indicator that performed well as a sell signal in 2008, in 2020, and in 2021. Over the years, its popularity has waxed and waned — the latter, because it was rather useless from 2010 to 2013. In this article, I’ll explain what the Baltic Dry is about, when it has performed well, and why it ran into troubles for some years. And then I’ll propose how to mitigate its problems, and how it could be a quite useful tool.
So, what is the Baltic Dry Index about?
It is quite simple: the Baltic Dry Index measures the demand for shipping capacity versus the supply of dry bulk carriers.
The demand for shipping varies with the amount of cargo that is being traded or moved in various markets. As the supply of cargo ships is generally quite inelastic (it takes around 2 years to build new ships), marginal increases in demand can push the index higher quickly, while marginal demand decreases can cause the index to fall rapidly. So, the index indirectly measures global supply and demand for the commodities shipped aboard dry bulk carriers, such as building materials, coal, crude oil, metallic ores, and grains.
Therefore, it is one of those rare beasts: an index unsullied by speculation (in contrast to the S&P500). Also, it works in a timely and precise fashion. In contrast, payroll or employment numbers are often estimates; consumer confidence is likely to measure nothing more than sentiment, often with no link to actual consumer behavior; gross national product figures are consistently revised, and so on.
When was the Baltic Dry Index a good sell and buy signal?
Well, for instance in 2007-2009:
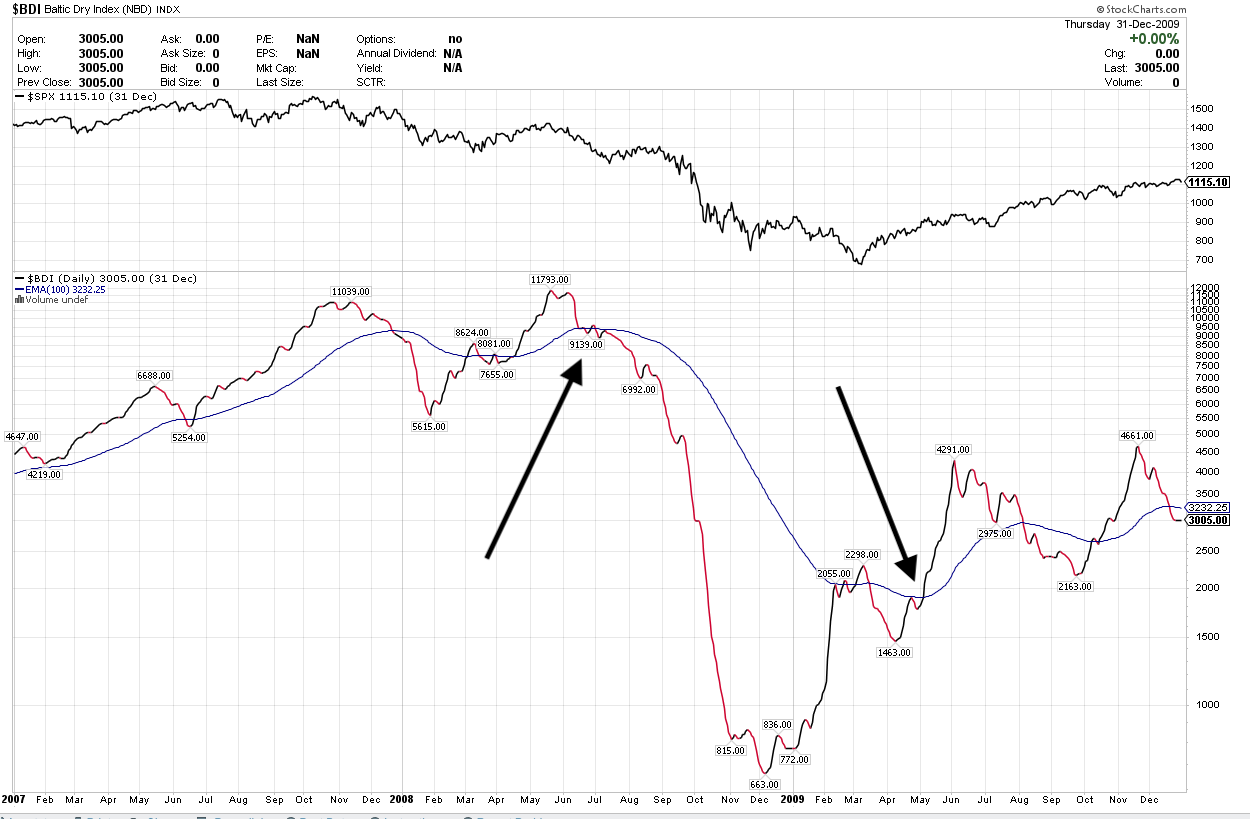
(Please note: I have added a exponential 100-day moving average to these charts which is used as a crossover buy/sell signal for the SPY/S&P 500 index, which is displayed above the BDI chart).
We see here that the BDI signaled “sell” in December 2007, re-iterated that signal in July 2008, and kept you out of the market until around March 2009. Pretty good call: you were in cash during the Great Financial Crisis.
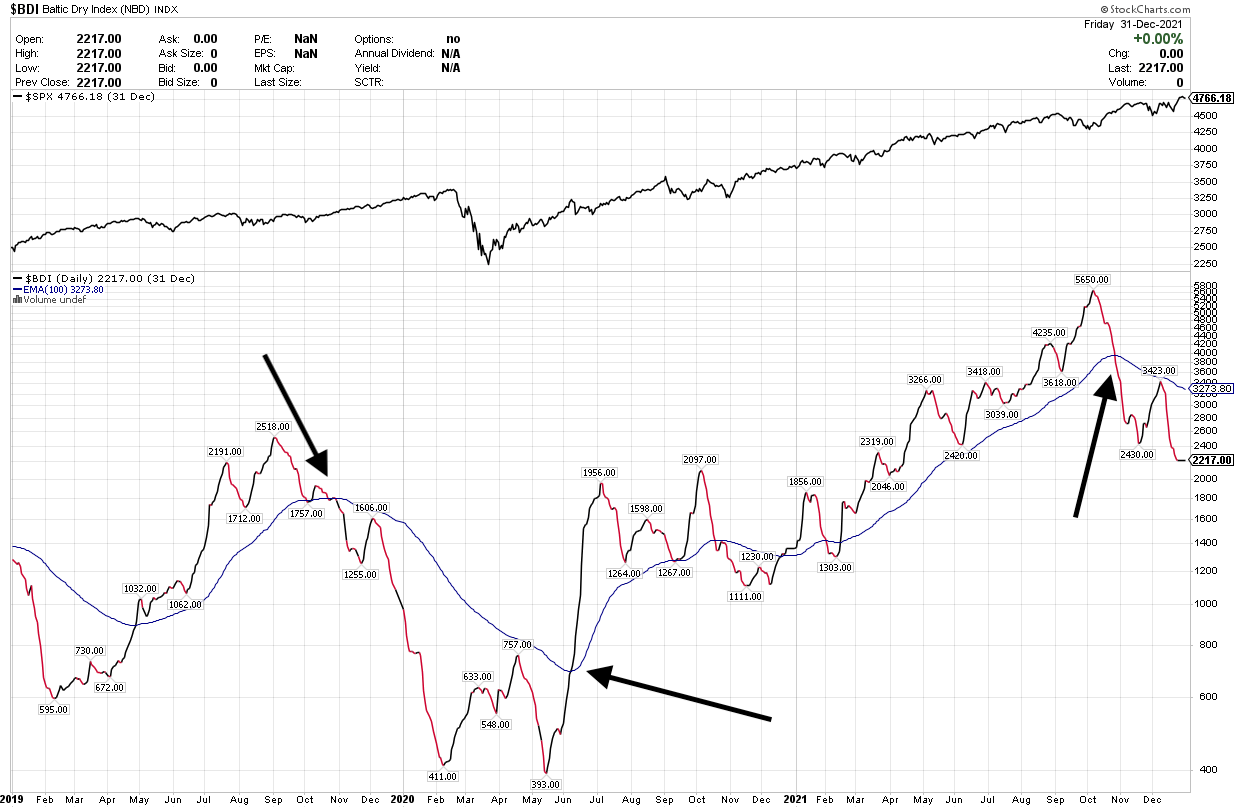
Or take our current choppy decade: Our Baltic signal told us to sell in November 2019, so we missed all the turbulence of the Covid-19 crisis. Our signal then indicated a “buy” in June 2020, enabling us to reap most of the profits of 2020 and 2021.
And in November 2021, the signal went risk-off — again, a pretty prescient call. We’ve been out of the market ever since.
OK, so it’s a pretty good signal before major market collapses, but it doesn’t always work well?
The problem with the Baltic Dry Index comes from the supply side — i.e., the amount of ships on the market. The demand data (how much needs to be transported) is clear and uncorruptable, but shipping prices also and strongly depend on how many ships are available to transport your goods.
We know this phenomenon from commodities such as pork bellies. High prices give pork farmers an incentive to breed a large amount of pigs. Once they can be slaughtered, prices fall, sometimes radically. (We Germans call this the “Schweinezyklus”, the pork cycle). So falling BDI prices do not necessarily mean that the economy is going into a recessionary phase — it may merely mean that more ships are available for transport.
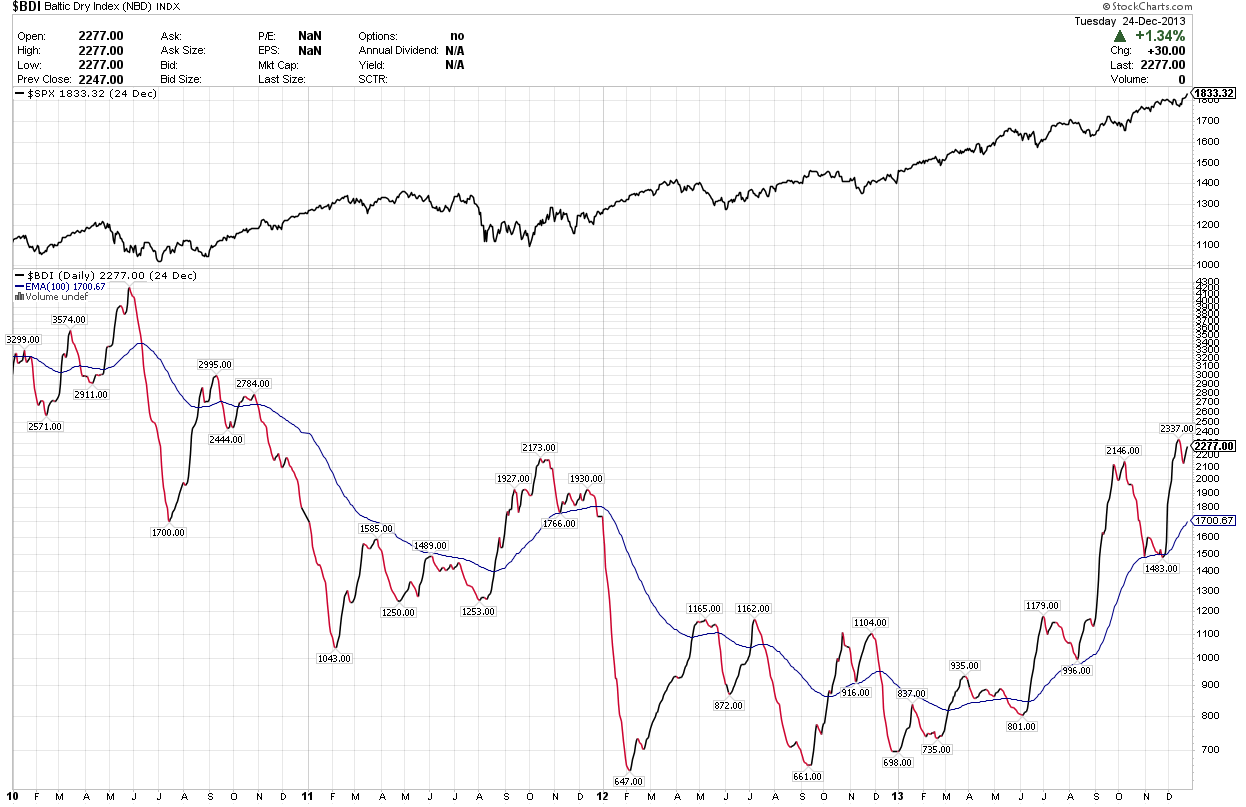
This is what happened from 2010 to 2013, when a large number of Chinese cargo ships had entered the market. Looking at the below chart, you see multiple sell signals that, for the SPY, didn’t make any sense at all.
So, it’s a flawed signal. What to do?
Flawed signals can be improved. For one, to mitigate the above described problems, just don’t sell when the market is in a positive trend. Wait for confirmation from the SPY’s price.
In other words, when the BDI provides a “sell” signal, just add a dynamic stop loss order to your SPY positions. Say, at -5%, or at -8%, depending on your tolerance for crash losses versus your tolerance for whipsaw losses. That means you won’t be selling if the market advances upwards, but you will hopefully be spared from the consequences of any major crash, bar a 1987-type one-day waterfall.
Admittedly, this is not a properly backtested, quantifiable strategy. Its assumed profitability is based on the heuristic that the key in investing is to prevent major losses, such as those of 2008.
(If you are able to backtest this approach, please let me know!)
Even without my suggested inferior-signal mitigation, some folks have managed to squeeze outperformance out of the BDI. Fred Piard for instance wrote about this in 2019. His look-back to 2000 worked reasonably well, despite covering (as I have described above) a difficult period in the BDI’s existence.
There is a newish BDI-based ETF on the market, and using it, I have constructed a naive buy-sell algorithm that has performed rather well since 2019. It sells the SPY when BDRY goes below its 100-day exponential moving average, and vice-versa.
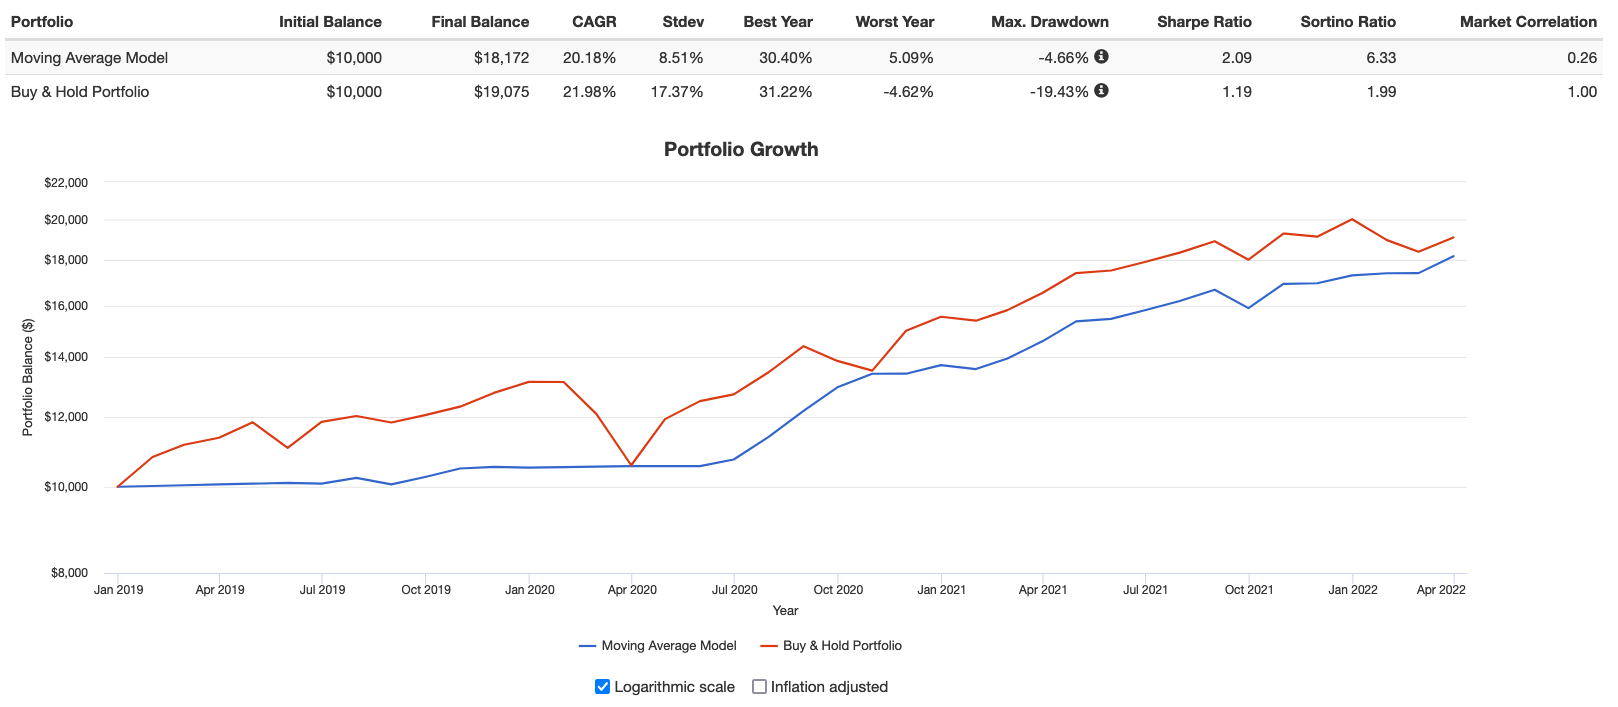
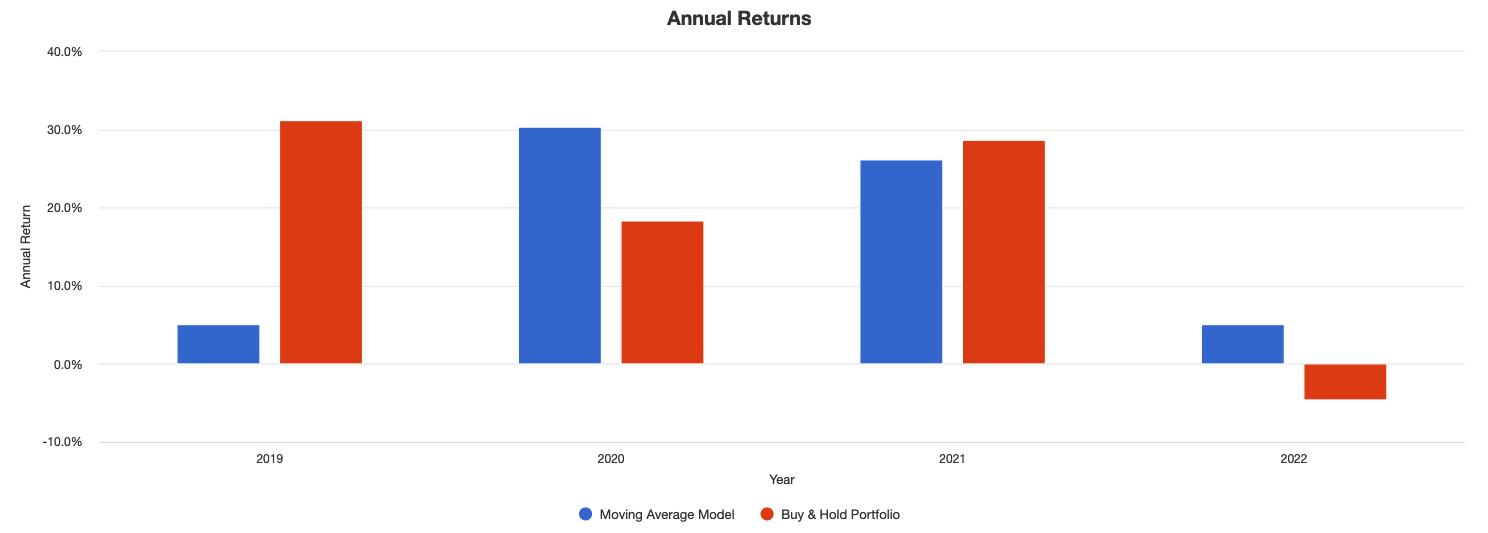
As you might imagine, this strategy is in cash right now.
Just keep in mind that this algorithm will stop working as soon as the next new fleet of ships hit the seas!
Here is a backtesting result that includes the stop-loss SPY enhancement: https://quantmage.app/grimoire/4b4c4c488b31464ae813e295eae1d5db
Nice article, Martin! I found some Baltic Dry Index daily data free (with sign-in) here: https://www.investing.com/indices/baltic-dry-chart
I imported the returns into Portfolio Visualizer and used it with your naïve buy sell algorithm as far back as it went (July 2012). The strategy spends a lot of time out of the market! You can boost returns extending the exponential moving average up to about a year/252 days.
But I think your assessment that it's not a sufficient signal on its own is correct. But definitely something to keep an eye on!
Thanks for explaining the significance -- I had heard of it but had not tried using it previously.