December's Yield-Curve Un-Inversion is Worrisome
...and a Happy New Year!

Hi, folks! I haven’t posted much at all recently. Why is that? Because for investing, no news = good news = I don’t post. I don’t want to be one of those guys who send out daily or weekly emails with advice that is not really investible. What do I know what the Fed is going to do? Who wants to hear which speculative take I might have on Trump’s economic program?
Suffice to say, I have recommended being invested since March of 2023, and continue to do so. So, you got in addition to last year’s gain of +24%, this year’s ?+20%? (we’ll see next week), adding up to well over 40%. Once again proof that doing very little is often the best thing that an investor can do.
The charts I watch still look very good (apart from the Baltic Dry Index). As a matter of fact, I could just re-post my article from last July titled, “Most of the Charts I Like, Really Like This Market”, and plenty folks wouldn’t notice a difference.
However, I will be posting a bit more in upcoming days:
Next week, I’ll send out my first-day-of-the-year update to how my Emerging-Markets-Mean-Reversion strategy performed, which will include my hold-for-12-months selections.
Soon after, I’ll post my analysis of how my stock market investing strategies performed in 2024.
But back to the headlined topic: Hello, Un-Inversion
The yield curve indicates whether interest rates are “normal”, i.e. whether short-term treasuries yield less than long-term treasuries (as they should: longer holding periods should be rewarded by greater gains).
In contrast, when the yield curve is inverted, this indicates that investors are moving money away from short-term bonds and into longer-term ones. Usually, this suggests that the market as a whole is becoming more pessimistic about the economic prospects for the near future.
Historically however, it’s not when the yield curve inverts that you have to worry. The critical situation is actually when the yield curve that was formerly inverted switches back to “normal” and is thus un-inverted.
Please take a close look at this chart (which expands when you click on it), going way back to 1981.
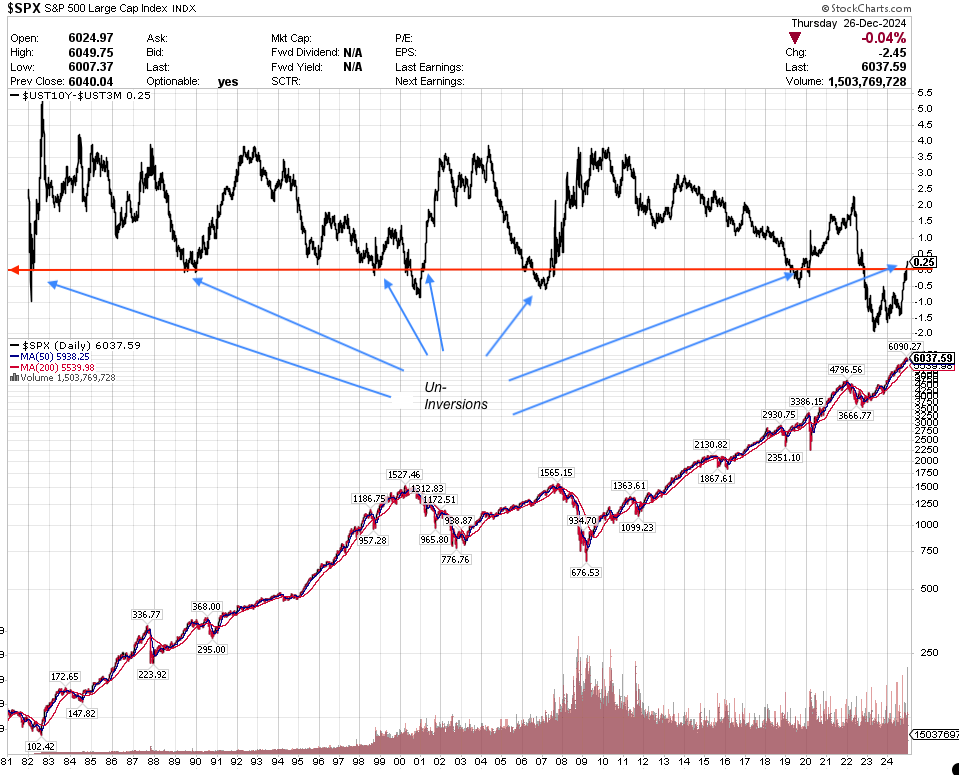
You have a situation of un-inversion when the value of ten-year treasury bond minus the value of the three-month treasury bond was formerly below zero, but then crosses into positive territory.
(It’s important to know that the definition varies. For instance, some people pair the ten-year treasuries with a two-year, instead of the three-monther as above. Hence, results can differ — yield inversions and the opposite can then happen more often, or less often. The interval between un-inversion and the subsequent recession can therefore be considerably longer than the two to six months that some have observed.)
In recent decades, such ominous crossovers have occurred in 1982 (which rang in the same year’s stock-market low), 1990 (followed by the mild George Herbert Walker Bush recession), and late 1998 (which presaged the Dotcom bursted-bubble recession).
The next episode was in 2007, warning us of the Great Financial Crisis. However, this was preceded by a very shallow dip in 2006, showing that such un-inversions indicate trouble ahead sometime in the future, but do not guarantee impending doom.
There was another shallow dip in 2019, which was confirmed by a stronger un-inversion signal later in the year, which as it turned out was ample warning of what was to happen in 2020.
And moving to the present time: the yield curve inversion that began in 2022 was anything but shallow and short — in fact, it was the deepest and longest in history. It ended on December 12. We are now firmly in un-inverted territory!
What does this mean?
The yield curve gets un-inverted when central banks start cutting interest rates, or are expected to do so.
But of course, reducing interest rates does not cause an economic downturn and a bear market. On the contrary, lower interest rates are generally positive. The un-inversion is more like an accompanying effect. It’s as if the market was saying: “the Fed usually gets things wrong. If even they can see there is a problem, then you know we’re really in trouble”.
There is no causal relationship between un-inversion and a sinking stock market, but there is an empirical and logical connection. It’s not like we were data mining moon phase data until we discovered that a full moon is beneficial to the stock market.
The “this time is different” crowd will be pointing out that the Fed doesn’t always get things wrong. It is noticeable, for instance, that by the time the yield curve un-inverted in 1982, most of the damage to the stock market had already been done. Lower interest rates meant the Fed had done its work to slay inflation, and good times were in store.
Mr. TTID sees a parallel between 1982 and 2024: no more inflation, and a miracle-working Republican president who will ensure peace and prosperity.
1990, or 2000?
Then there are those who point out that a recession doesn’t have to be a stock-market killer. Anybody who tried to time the 1990 bear market (only 20% from top to bottom, in just three months) burned their fingers.
On the other hand… valuations in 1990 were a fraction of what they are today. Stocks were cheap! When equities are in a bubble however, like they were in 2000, a bear market can be quite painful (-49%) and go on for what felt like forever (three years, yikes!) Do you really want to own stocks during that kind of an era?
My conclusion:
To ignore an indicator that has as good a track record* as the interest-rate un-inversion would be imprudent.
Sadly, this indicator is not a timing signal. It will not tell us when the music is going to stop. All it says is: keep your knees flexed, your ear on the record player, and your behind near a chair.
All things being equal, I will in 2025 be more trigger-happy than I would be under different circumstances. It won’t take many of my signals to turn red for me to sell stocks.
Sorry to be a Debbie Downer! But it’s not just the buying stocks that make you money; the selling also counts. I’ll let you know, of course, as soon as I see a reason to take action.
“Guten Rutsch”, as we Germans say!
*”An inverted yield curve, which occurs when short-term debt yields more than long-term paper, has been a harbinger of a recession in nine out of 10 instances over the last 70 years, according to Deutsche Bank data.” (Source).
Thanks for another excellent article, Martin. I especially liked “keep your knees flexed, your ear on the record player, and your behind near a chair.”
Two indicators I use that have me concerned are ‘NYSE Percent of stocks above 200 day moving average’ and ‘NYSE Advance-Decline issues’. They are both below the line I use for evaluating. Guten Rutsch to you too!
I'm perplexed by why BDRY keeps falling while consumer spending is up and the economy is doing well. After some digging here are some explanations:
1. A substantial drop in dry bulk shipping rates. As of December 11, 2024, it fell to 1,106 points, marking its lowest level since September 2023. This decline reflects reduced demand for shipping capacity and lower freight rates.
2. Oversupply of Shipping Capacity: Fleet Expansion: In 2023, approximately 32 million deadweight tons (DWT) of new dry bulk vessel capacity were delivered, with an additional 30 million DWT expected in 2024. This increase in supply has outpaced demand, leading to heightened competition among shipowners and driving freight rates down.
3. Geopolitical and Operational Challenges: Rerouting due to Red Sea Instability: Attacks by Houthi rebels in the Red Sea have forced vessels to take longer routes around the Cape of Good Hope, extending voyage times and disrupting schedules. While this has temporarily increased demand for shipping capacity, the associated operational challenges have contributed to market volatility.
4. Commodity Demand Fluctuations: Iron Ore and Coal Shipments: Projections indicate that iron ore shipments will grow by 3.0% from 2023 to 2025, while coal shipments could decline by 4.0% by 2025. These shifts in commodity demand directly impact the volume of goods transported by dry bulk carriers, influencing freight rates.
5. Economic Growth Projections: Forecasts suggest that global GDP could grow by 2.9% in 2024 and 3.2% in 2025, below the average annual growth rate of 3.7% observed between 2010 and 2019. Slower economic growth can lead to reduced demand for raw materials, affecting the dry bulk shipping industry.
So, while consumer spending and certain economic indicators remain strong, the dry bulk shipping sector faces specific challenges, including declining freight rates, fleet overcapacity, geopolitical disruptions, and fluctuating commodity demands. These factors have collectively contributed to the recent underperformance of BDRY.