This is just a quick one I’m shooting out on a Saturday morning between coffee and our weekend shopping…
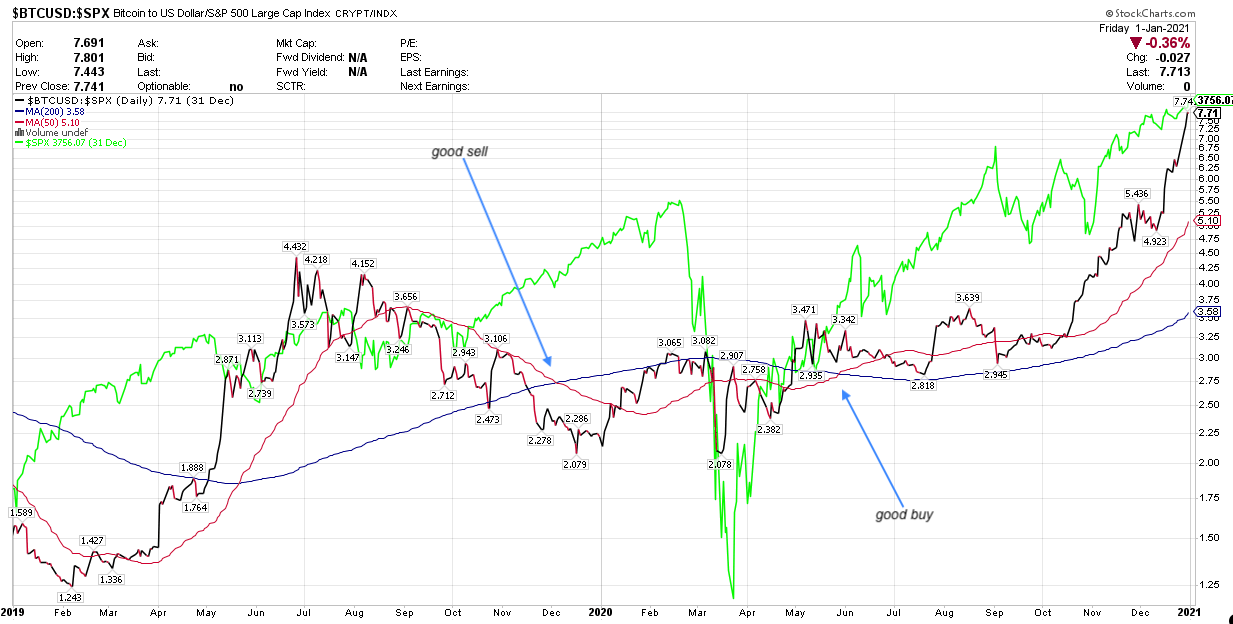
Chris Ciovacco, in yesterday’s as usual must-watch weekly video (after the 5:45 mark), pointed out how Bitcoin is a quite good indicator of the market’s appetite for risk, as well as for general market liquidity.
Now, surely you have noticed how, contrary to what hucksters told you up to 2022, Bitcoin is a useless hedge against inflation, and also doesn’t help you when the market has entered a bearish phase. Claims have been made it’s as good as Gold, but these claims haven’t played out in real life. If anything, in lean years BTC loses more than more conventional assets.
What really made me prick my ears was when Chris mentioned how Bitcoin was an early indicator of bad things to happen in 2020. So I really had to take a closer look.
Works for me!
I’m intrigued, so let’s test this. What happens when you buy / sell the S&P 500 (ETF: SPY) whenever Bitcoin crosses above or below its 200-day moving average? (Actionable at month’s begin).
Results from 2015: CAGR 12.73%, maximum monthly drawdown -12.05%, worst year -7.35%. (Source: Portfoliovisualizer).
Which compares favorably (in terms of risk-adjusted return) to buying and holding the SPY: CAGR 13.01%, maximum monthly drawdown -23.93%, worst year -18.17%.
Using Bitcoin’s price is much more effective than using the SPY’s 200-day moving average as a buy/sell signal, which would perform thus: CAGR 7.5%, maximum monthly drawdown -21.69%, worst year -19.95%.
And vice-versa? Can you use the SPY’s price action as a signal to buy or sell Bitcoin?
Yes, you can, but it doesn’t make much sense. Performance of Bitcoin is slightly lower this way. It’s better to invest in Bitcoin based on its own price action.
As my loyal readers know, I like any strategy with a MAR of over 1 (meaning, if the growth rate is higher than the maximum drawdown).
I particularly like signals that prevented year-over-year losses in 2020 and 2022.
Will this almost predictive correlation between Bitcoin and the stock market continue in the future? This we cannot know, so please don’t get over-enthusiastic about this signal (even though even a leveraged version with SSO works quite nicely).
What do you think? Is this signal legit? Are you a fan of Bitcoin, even if you aren’t a money-launderer or a membor of the Mafia? Tell me in the comments, please.
Addendum January 12: I’m really not sure whether this signal should be considered valid in the present time. Bitcoin has been pumped up very much in recent weeks due to the expectation that Trump is crypto-friendly. Thus, Bitcoin’s price may no longer to 100% reflect the animal spirits of the stock market in general, and may instead for the time being more accurately reflect the testosterone levels of the crypto crowd. TBD. Nonetheless, I’m adding BTC to my signal toolkit.
Addendum February 17: There was a flaw in Portfoliovisualizer’s data feed: it didn’t have the most up to date information, nor go back in time far enough. I complained, they repaired it, hurray! Now we have results going back to the beginning of 2012. For the unleveraged version with SPY (which is the S&P 500 ETF), up to end-January 2025: CAGR 13.24%, max monthly drawdown -7.65%, worst year 1.69%. This is a really excellent result attained through using a daily potential sell signal. Yes, that means 93 signals in 12 years which is a lot, but not excessive imo. What do you think? Rather lose some performance but have less tsores with all the buying and selling? In any case, from March 1 onwards, I’m jinxing this one by adding it to my collection of strategies, with a single weighting. Replicate it here:
https://tinyurl.com/5dkfzje2


Thank you for sharing. What I did was combine the SPY chart and below it the MACD of IBIT. It looks to have given two strong sell signals, one in March, before the April pullback; and a second signal in late November, to miss this current pullback.
I enjoy learning from your work. Thank you.
An interesting idea! I came up with https://quantmage.app/grimoire/ac60c2facfc437d08b5c4107e22cd3c8 based on it.