

Believe It or Not, Baltic Dry Says, "Buy"
One more indicator that isn't buying the gloom and doom narrative

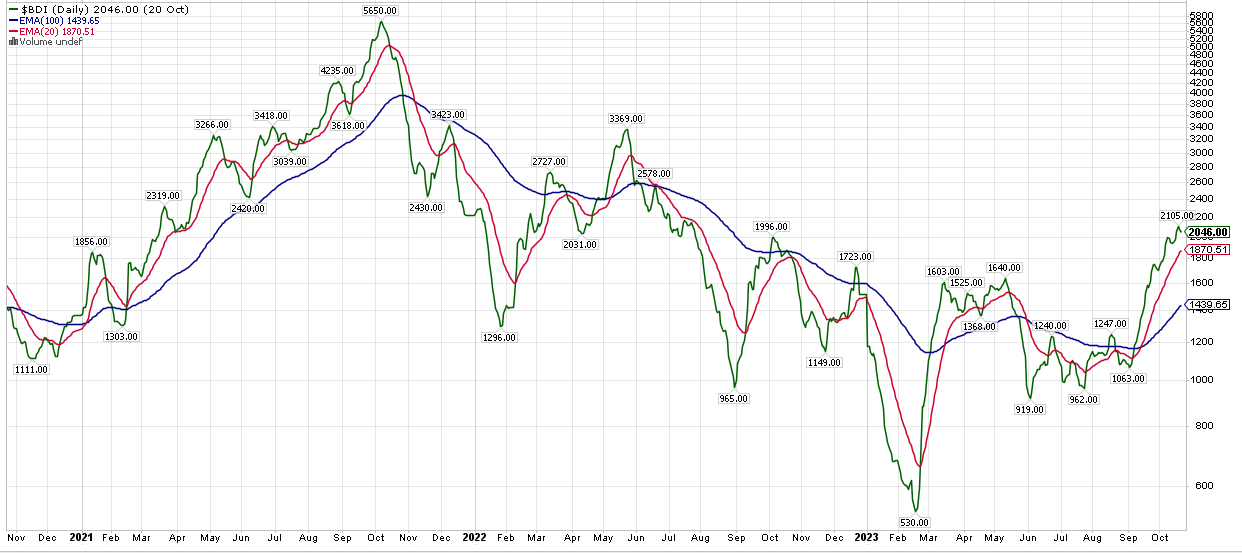
Where are we coming from, and where are we now?
The Baltic Dry Index tells you the price for shipping dry goods such as lumber or wheat across the world. I originally wrote about it back in April, 2022. At the time, it seemed to be a pretty useful indicator, being as it is a purely economic index determined by current market demand and supply, and not subject to speculative manipulations as stock market indexes such as the S&P500 can be.
It has a remarkably good track record in sniffing out when a storm is going to hit the global economy. It went risk-off in July 2008, November 2019, and in November 2021.
My buy-or-sell rule was simple/naive. Buy the S&P500 when the BDI is trending above its 100-day moving average. (I have since refined this rule a little bit to a 100/20-day crossover).
But then… nothing happened. In the 18 months ever since, the BDI only said “go” for a few weeks in this and last year. Meanwhile, a lot of other signals indicated risk-on. Why did Baltic Dry stay dry, when others were getting their toes wet?
China’s belated post-Covid resurgence may be a main reason, but the Russo-Ukranian war was probably also a factor (you don’t need ships to ship grain when ports have been destroyed). Add the general de-globalization effects of Bidenomics, and you get a stagnant shipping market.
But that was then, and this is now. The BDI has been on a firm upwards slope since September, and had a moving-average crossover in the same month, which could be considered a buy signal.
Note however, that my actual strategy used BDRY, an ETF, as a proxy for the BDI. This is because my tool of choice, Portfoliovisualizer, does not enable the use of pure indexes (as the BDI happens to be).
There is a considerable difference between the two; the ETF lags the index:
BDRY does not track the BDI. The Baltic Dry Index (BDI) is a spot index, reflecting where the spot market is at any given day. In other words, BDI is a snapshot of the dry bulk market and it’s uninvestable (no one can invest on the BDI). BDRY is a passively managed fund, an ETF, investing in freight futures over the next 60 trading days, on average. Futures settle against monthly averages, not at a specific day. One can think of BDRY as the ~3-month average of BDI. BDRY does not track the BDI, it loosely follows the BDI (through futures). Nevertheless, the weekly correlation over the two in the last two years is about 75%, despite the fact that one is a spot freight index and the other one is a freight futures fund. — Thanos Sofios
In practice, in recent years, the ETF has been invested less often than the corresponding index. That is been advantageous, leading to the strategy’s excellent performance of a CAGR (compound annual growth rate) since 2019 of 16.02%, with a maximum monthly drawdown of -4.66%.
(And you might note that the maximum drawdowns for this variant are even OK if you added leverage:
SSO (2x SPY): CAGR +30.44%, mdd -9.41%
SPXL (3x SPY): CAGR +46.08%, mdd -13.78%)
How about longer-term data?
Of course, a backtest from 2019 is only for wishful thinkers. The BDRY ETF is rather young, so a longer-term test isn’t possible. So, I took a look at what happened if one bought and sold SPY (the S&P 500 ETF) based on a 20/100 day moving-average crossover of the BDI index.
The results from May 2003 to the last sell episode (on May 31, 2023) are:
33 sell trades
25 positive, 8 negative trades
average profit/loss: +4.47%
maximum negative trade: -8.22% (in 2008)
average negative trade: -5.11%
This is a trading strategy, and not a stand-alone permanent investment approach. There are months, sometimes years on end when you would be un-invested if the BDI was your only signal. Thus, the CAGR of this strategy if you used it as your only investing strategy is rather poor: +4.88%.
What to do?
BDRY may generate signal a buy in the upcoming days. I’ll publish an action alert when the time comes.
The BDI index has been, as stated above, risk-on since mid-September. I began buying some SPY last Friday, and will scale into a minor position in the days to some.
I also continue to use the BDI as one of several buy/sell signals, including for example in addition the Zahorchak indicator, the Coppock curve, Bollinger Bands, as well as others. All are basically in green territory, which of course does not mitigate any losses one might have had in the challenging period we’ve gone through since September.
Good luck, and take care! And always remember that quote from Bernard Baruch: “The main purpose of the stock market is to make fools of as many men as possible”.
Also CRAK works with link https://www.portfoliovisualizer.com/tactical-asset-allocation-model?s=y&sl=4puk2Ntwaa8fjhQ5kLQUeT
If you like to trade BDRY, this link will help. Thanks. https://www.portfoliovisualizer.com/tactical-asset-allocation-model?s=y&sl=73bYAQgUmzlwpmyRaLdWtQ