
Shall the Best Follow the Worst?
Shall the Best Follow the Worst?
Investing in beaten-down countries is tricky, but it can be very profitable

Check out this beautiful interactive chart:
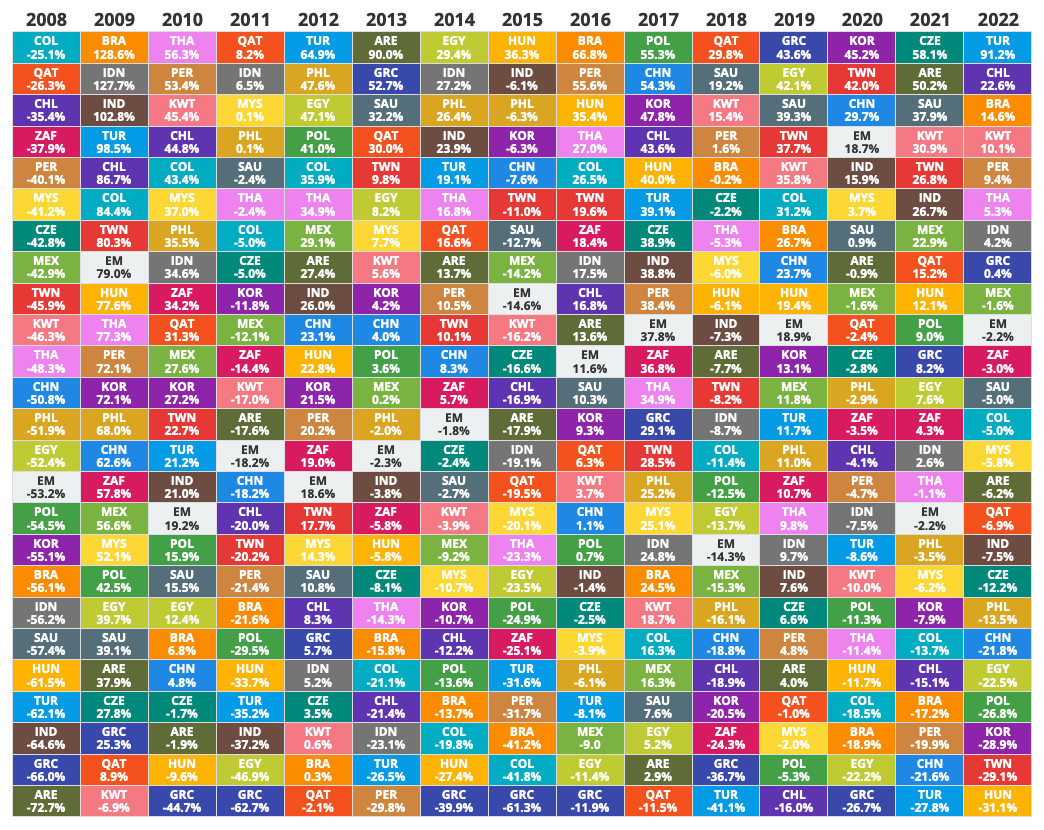
It shows how much you gained by investing in the emerging-country stock market that had fared worst in the previous year.
Incredible! Im 2021, Turkey was the biggest loser, but in 2022, it gained a whopping 91.2%
Or take Argentina in 2008 (2009: +37.9%), or Kuwait in 2009 (subsequent year: +45.4%).
Perhaps there is some fabulous return-to-the-mean stuff going on here, from which we can profit. Emerging markets are rather bipolar; they undershoot one year, then overshoot the next. Let’s get in on the undershoot, and make a killing on the over!
So, I thought this would be worth taking a closer look.
Unfortunately, simply buying the last year’s worst performing country index is not as juicy as the first impression might indicate.
Looking at the chart, we can see that Greece spoils the results of a number of years: in 2010, 2014, and 2015, this strategy had terrible performances, creating losses of over 60% twice.
I calculated the effectiveness of buying last-year’s worst performer from 2008 to 2022: during this time, this approach had a CAGR of merely 2.6%.
So why not just refrain from investing in Greece, and instead buy the second-worst country on the table whenever Greece would normally be your investment? That improves things marvelously, and we now have a CAGR of 19.8%.
But obviously, that is a bit facile — something one only does with a ton of hindsight. Sure, Greece had a unique multi-year structural crisis caused by joining a rigid currency union, after it had cooked its books. But other countries also have wobbly public finances (Argentina and Turkey, for instance). Is potential hyperinflation (Turkey) really better for the stock market than austerity+stagnation+consolidation (Greece)?
Second tier, third tier?
Perhaps the worst isn’t the best after all; let’s see what happens when we buy each year’s second-worse performing country stock market.
Nope: CAGR = 10.33% (not good enough for me when the worst year is -33.7%, and probably a fair amount of luck is involved).
How about the third-poorest performing country of every year? That’s even less useful, CAGR = 2.5%.
Top 10, Top 20?
How about concentrating on the top 10 and top 20 emerging-market economies? After all, very small countries like Greece or Peru are potentially very unstable and can fall into multi-year crises. So I used Wikipedia’s list of the largest emerging-market countries, subtracted rogue states like Iran and Russia, with these results:
Top 10: CAGR = 12.4%
Top 20: CAGR = 8.6%
Not terrible, but still no cigar!
Time to Throw in the Towel?
The problem with these emerging-market stocks seems to be that they can fluctuate violently within each year, sometimes ending up deep in the red by year’s end.
A common way to reduce the volatility of an asset would be to filter its price through a moving average.
(This is an idea that kind contributer “Drftr” shared with me, and by the way, he pointed me to the whole country-performance table, so this post would not have been written without his heads-up!)
In other words, sell Greece (or whatever asset you might have bought in early January of a random year) whenever it has broken through (for example) its 10-month moving average.
In 2014, according to the “buy the worst market of 2013” rule, we would have lost 61.3% by buying GREK (the Greece ETF). But a moving average filter would have reduced this loss to 0.12%!
And in 2015, our loss with GREK would have been reduced to zero, from formerly -11.9%.
(Unfortunately, we cannot test the equally negative year 2010 — the GREK ETF didn’t exist back then).
Sadly, where there is light, there is also shadow. A moving average not only filters out noise, but also potentially filters out some gain. TUR (the Turkey ETF) gained only 56.76% last year if you applied a moving-average safeguard to it, down from 91.2%.
How does this all add up, and crucially, does it mean we can make a lot of money with the “buy the biggest loser”-rule? I am sorry to say I can’t answer that question, as many of the emerging-market ETFs that we would be buying going forward didn’t exist ten years ago. Therefore, I can’t backtest them.
All things considered, I would hope that this strategy could now earn ?8-14% p.a. No promises, no guarantees! Just some logic and some evidence.
But a full disclosure: I did buy the Taiwan ETF “EWT” a few days ago. Just a little amount, to tip my toes in the water. Subscribe to my channel, and I’ll let you know how that panned out!
PS, added one day later: no, I haven’t bought Hungary yet. (By the way, my US readers probably can’t; I could identify only a EU-based UCITS ETF for that country. There may be a proxy, MGYOY, the Hungarian Gas and Oil company, which yields 10.49%.) I am not yet convinced the ETF is liquid enough, and am looking for further information.
Meb Faber Tweeted about this subject today.
https://twitter.com/MebFaber/status/1622635983765377029
I wasn't aware of this: A country that has been down two years in a row gains on average (time frame 1903-2007) +19.03%
If we're talking about three years, it's +30.3%!
(Both Columbia and the Philippines were down 2020, '21 and '22, by the way.)
I feel a little stupid that I didn't think of this "two or three in a row" approach, but what the hell.
I'll post an update on "two in a row" candidates tomorrow...
For a higher-level view of recent market history, I checked Novel Investor's crazy quilt of asset class returns: https://novelinvestor.com/asset-class-returns/
The worst performers of 2022 were REITs, small caps, and emerging markets (from worst to least bad).
Cash and high yield bonds were at the top. For the last three months, the order has largely (but not exactly) reversed:
https://stockcharts.com/freecharts/perf.php?VOO,VNQ,VNQI,VWO,VEA,VB,JNK,LQD&p=2&O=011000
The top performers over the more recent period are emerging markets, foreign developed markets, and REITs. Specifically, the global ex-US REIT ETFs (VNQI, IFGL) are beating US real estate investment trusts (VNQ, IYR).
Foreign REITs are sort of a forgotten asset class for most US investors -- much like no one wanted to hear about large cap growth stocks in 2005, after five years of underperformance in the wake of the DotCom crash. If you double click the time scale slider in that PerfChart link and enter 1260 trading days (five years), we find that VNQI is the worst of the worst! VNQI has total nominal returns of -16% over the last five years. Real (inflation adjusted) returns would be even worse. Momentum investors have forgotten about this asset class for obvious reasons.
My quote for the day, from an interview with Antii Ilmanen:
Cliff has got this lovely quote, “People act like momentum investors at reversal horizons.”
https://mebfaber.com/2022/05/09/e413-antti-ilmanen/