Introducing the Zahorchak Method
an addition to my collection of strange indicators -- and it's saying "don't buy yet!"
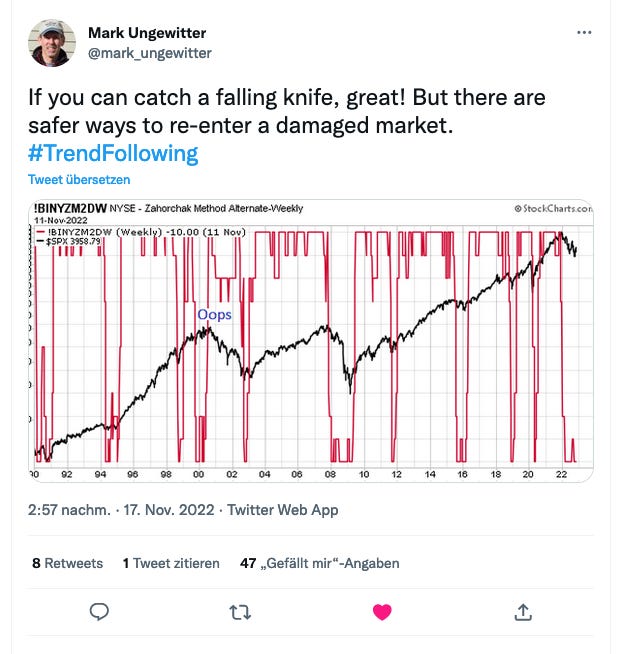
Isn’t Twitter a lovely place? It’s where the biggest brains share their knowledge with you. (Granted, it’s also the intersection of nasty and stupid, but you need to block all those malefactors). It is where rather famous investor Mark Ungewitter recently posted,
Take a quick look at the above chart, and you’ll see it had an excellent record of taking you out of the market (approximately when the vertical red line crosses the SPX line going down). And it was also a very successful signal for re-entering the market (vice-versa, about when the vertical red line crosses the SPX line going up).
Excellent, but not flawless, because of the episode marked by “oops”: in late 2000, it made the fatal mistake of recommending an entry — over two years too early.
Before this, I had not heard of the Zahorchak Method indicator. It is not to be found on Investopedia, and Michael G. Zahorchak’s book, “The Art of Low Risk Investing”, is out of print, and expensive if you can get it. Here’s what I distilled from a Seeking Alpha article from 2019: “The Zahorchak Method is an interesting indicator that combines trend following techniques with breadth/participation indicators.
The general idea is that you sell when the Zahorchak indicator is breaking down (e.g. falls below -6), and buy when the indicator is breaking up (e.g. rallies above 0)
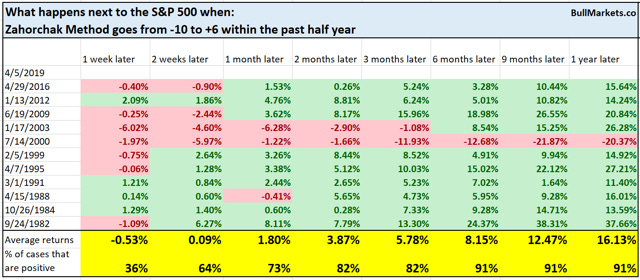
Here’s what happens next to the S&P 500 when the Zahorchak Method goes from -10 to +6 within the past 6 months.”
Again, we see that generally, Zahorchak is an excellent signal for re-entering stocks after a pull-back, or after a bear market. Since 1982, the average return after a year was +16.13%, and would be a lot better yet, if it wasn’t for that miserable case of 2000-2003. But hey, a 91% success rate in 37 years is nothing to sneeze at!
That said, if you look closer, you do see some other episodes of subperformance. In late 2018, Zahorchak indicated selling and then buying back after a few weeks, at a minor loss.
Typically for momentum indicators, it also performed unsatisfactorily during the Covid crash, telling you to sell in April 2020, while the market was already recovering. The Zahorchak sell signal should probably be ignored until confirmed by a tight moving stop, to prevent this kind of nonsense.
Looking back even further, the Zahorchak indicator also did not foresee the 1987 crash.
But as a very big positive, I particularly like how Zahorchak leaves you undisturbed during multi-year stretches of a bull market, so that you can enjoy being invested, together with the concurrent gains.
And right now…
At the present time, Zahorchak is in no way recommending getting back into stocks. There’s no sign of that red line charging at the S&P500; it’s basing at the -10 level.
But I’ll be watching this signal on a regular basis. Smash the “subscribe” button if you want to receive an alert when Zahorchak says “risk on!”
And please let me know in the comments what you think of this signal. Is Zahorchak an out-of-fashion indicator that deserves being re-activated? Or does it justifiably belong on the scrap heap of investment tools, ever since it performed so lousily in 2000-2003?


Martin, Thanks for the notice of this signal method.
Is this something that yu will follow and update?
Nice article Martin. Did you look at combining this with other indicators? How tight of a trailing stop would you recommend to confirm the sell signal?