How I'll Know If I'm Wrong
I'll re-think my thesis if these things happen

My base case remains that the damage is done: massive tariffs on China are recessionary, erratic tariff policy holds up investment planning, and the Fed is neutered — it can’t do a thing, because tariffs are inflationary.
Which leads me to a recessionary outlook, which leads me to a negative stock market outlook. Recessions are bull market killers, as you know.
However, don’t trust me: I’m by no means the smartest guy in the room. (As a rule, I avoid spending time in such rooms… they’re boring! Nothing to learn here!)
In this article, I’d show you some examples of folks who are saying this semi-bear market is merely an intermezzo. An investment opportunity, so to speak.
And then I’ll give you a look at my little toolkit of indicators that at some point might say, “hey wait a minute, this might be a bull market after all!”
Dr. Doom: “Who cares? A.I. will create a boom”
Nouriel Roubini became famous after he anticipated the Great Financial Crisis in 2006. He is generally quite sceptical when others are bullish, but right now, what was once Dr. Doom is now Dr. Boom:
“Artificial intelligence is set to transform a dozen major sectors, propelling economic growth. By the end of this decade, US growth could hit 4 percent. By the end of the next decade, we might see 6 percent.”
“Indeed Mickey Mouse could be US President and the economy will keep on growing fast as: Tech Trumps Tariffs! Tech Trumps Trump Too!”
My counterpoint: Dr. Doom has plenty of ideas. In 2020, he thought the Pandemic, plus government debt, would lead to a decade-long depression.
Not to mention: sure, Mickey Mouse would probably be a good President. Kind, reasonable, aware of his deficiencies, and supported by a good staff (you can’t go wrong with Minnie and Pluto). If he was the boss, I’d likely be in the bullish camp, too.
Mel Mattison says, “nothing has changed, federal spending and inflation are up, Doge was a fiction, tariffs are a distraction, the bull will resume.”
He’s a smart guy. Follow him on the Xitter! Good (if lengthy) interview here.
Tom Bowley: the Bottom is Nigh
I’ve learnt a lot from his videos and articles, and his track record is pretty good. He called the end of the 2022 bear market slightly early (in June), but from there, you lost less than 2% until the final low in October 2022.
His current reasoning includes the observation that a VIX (volatility index) spike as we have recently witnessed almost always signifies the end of a bear.
My counterpoint: VIX data is generally too shallow — it only goes back to 1990. And there have been some double or triple spikes (2008, 2022).
So here’s what I’m looking for:
My basic method involves selling on a 5% Canary signal (which was generated on March 12, as my loyal readers know).
In contrast, my risk-on indicator of choice is very simple, and only based on price: buy when the S&P 500 is at least 3% above its 200-day moving average. This is the “Bill Sadek 3%” signal.
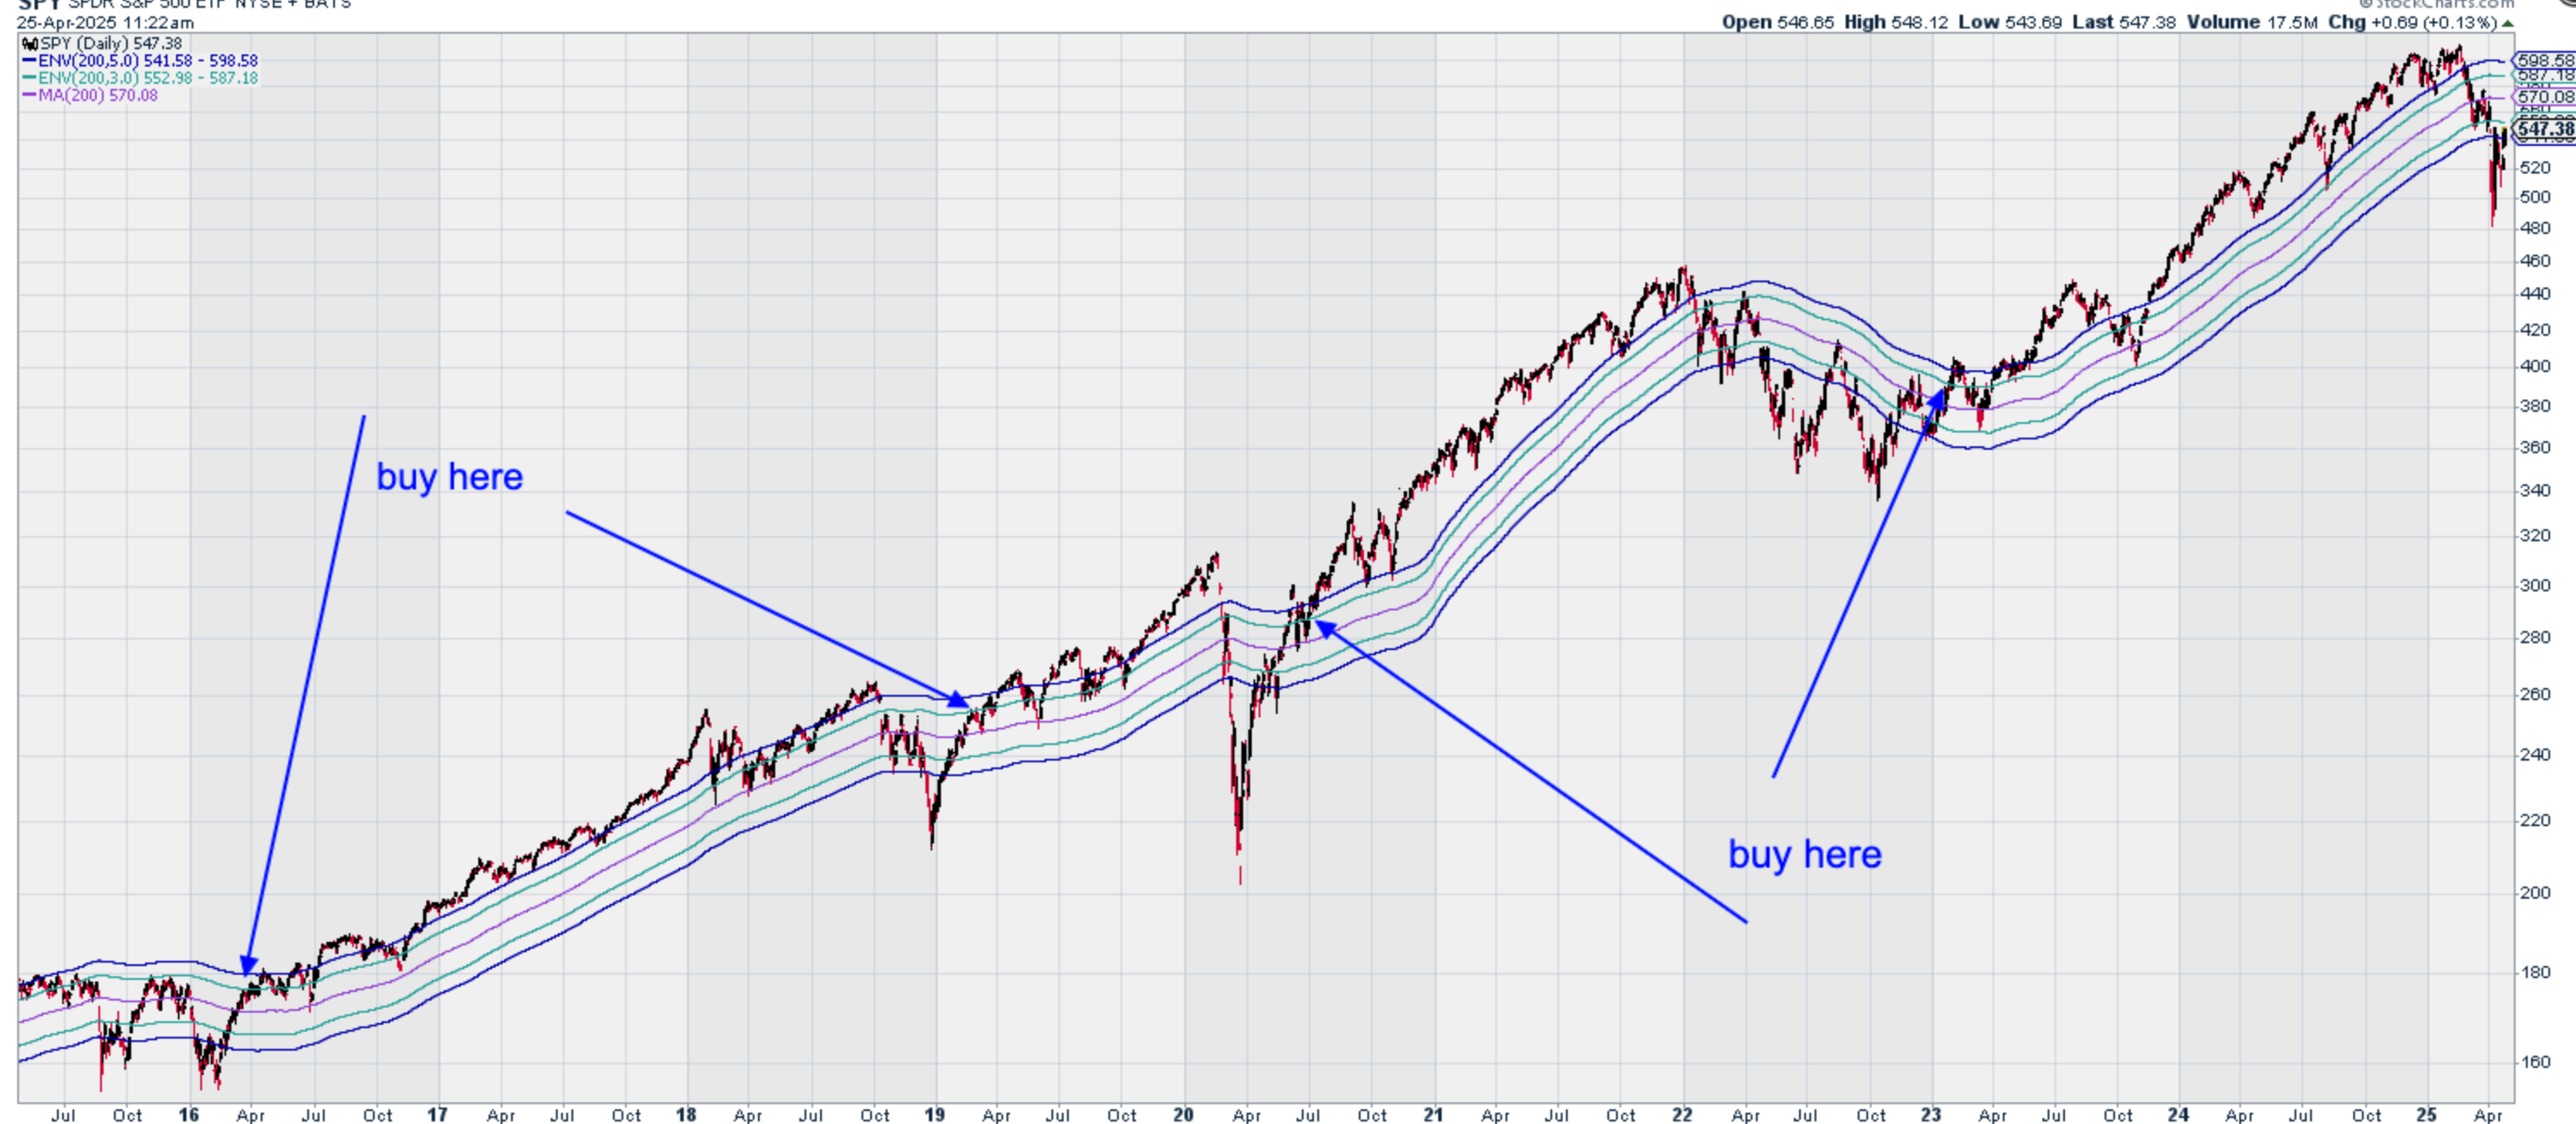
Of course, a momentum-based signal such as this does not perform particularly well in a V-shaped market. The Pandemic Market of 2020 was testiment to this. So I am always willing to front-run the Sadek Signal, if some strong evidence was clearly visible. Such as:
A Lowry 90% Downside Day, Followed by a 90% Upside Day
A Lowry 90% Upside or Downside Day is a technical indicator used in stock market analysis to identify significant market turning points, particularly major bottoms or tops, by measuring extreme levels of buying or selling pressure. Developed by Lowry Research, this concept is rooted in the study of supply and demand dynamics and has been refined through decades of market analysis, notably by Paul F. Desmond in his 2002 Charles H. Dow Award-winning paper, "Identifying Bear Market Bottoms and New Bull Markets."
A 90% Downside Day occurs when::
Downside Volume equals or exceeds 90% of the total of Upside Volume plus Downside Volume on a given exchange (typically the NYSE).
A 90% Upside is similar, but opposite.
90% Downside Days indicate panic selling, often associated with significant market declines. They are a hallmark of capitulation, where sellers exhaust themselves, setting the stage for a potential market bottom. (Us Germans say something equivalent to, “the market has finally vomited out all its poison”).
90% Upside Days signal panic buying, reflecting strong demand that can mark the start of a new rally or bull market. Put in modern terms: FOMO, baby!
For a market bottom to be confirmed, a 90% Upside Day (or, in rare cases, two back-to-back 80% Upside Days) typically follows one or more 90% Downside Days within a short period (e.g., days to weeks).
In any case, this hasn’t happened yet. We got close in those terribly volatile days earlier in the month, but no cigar.
I’ll let you know when it we do get such a success of strong down / strong up days. Alternatively, follow good ‘ole Walter Deemer, on Twitter.
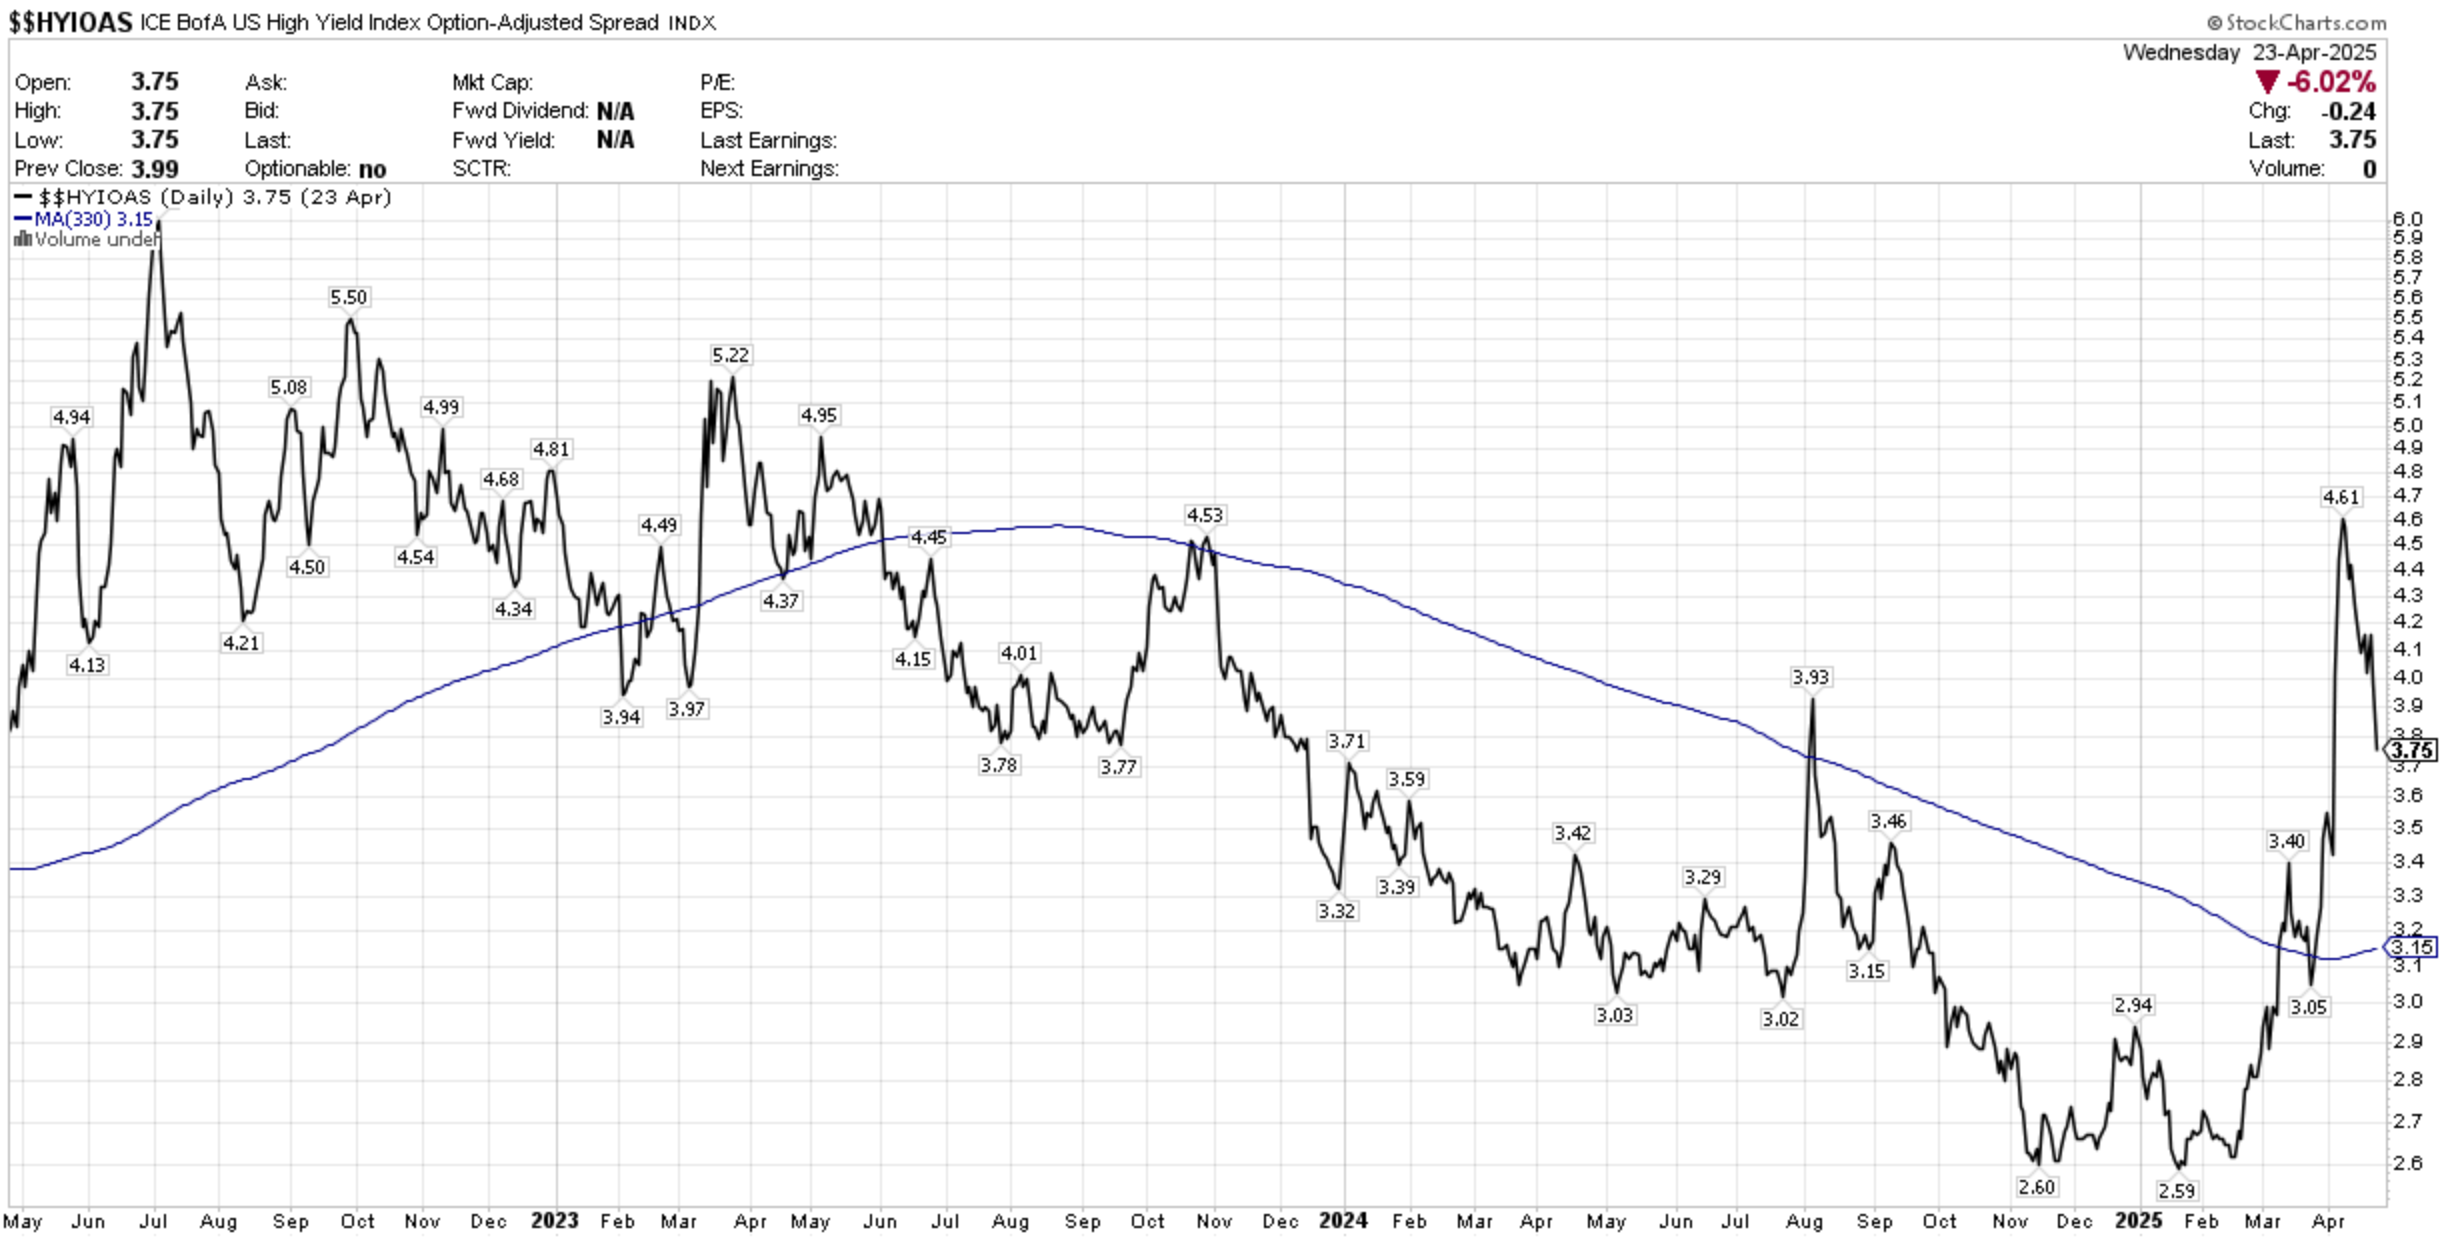
Hi-Yield Adjusted Spreads
I know, I’ve posted a lot about this in recent weeks. They’ve improved, but we’re not at all in a safe territory yet. Watch that blue line — we need to get under it, or at least close. I’ll keep you updated.
Steve Strazza’s "signal of all signals"
Earlier this month, some folks like Alfonso De Pablos were pointing out: “The % of S&P 1500 stocks above their 200-MA just dropped below 15%. Historically, a buy signal comes when it climbs back above 15%. That’s your trigger.”
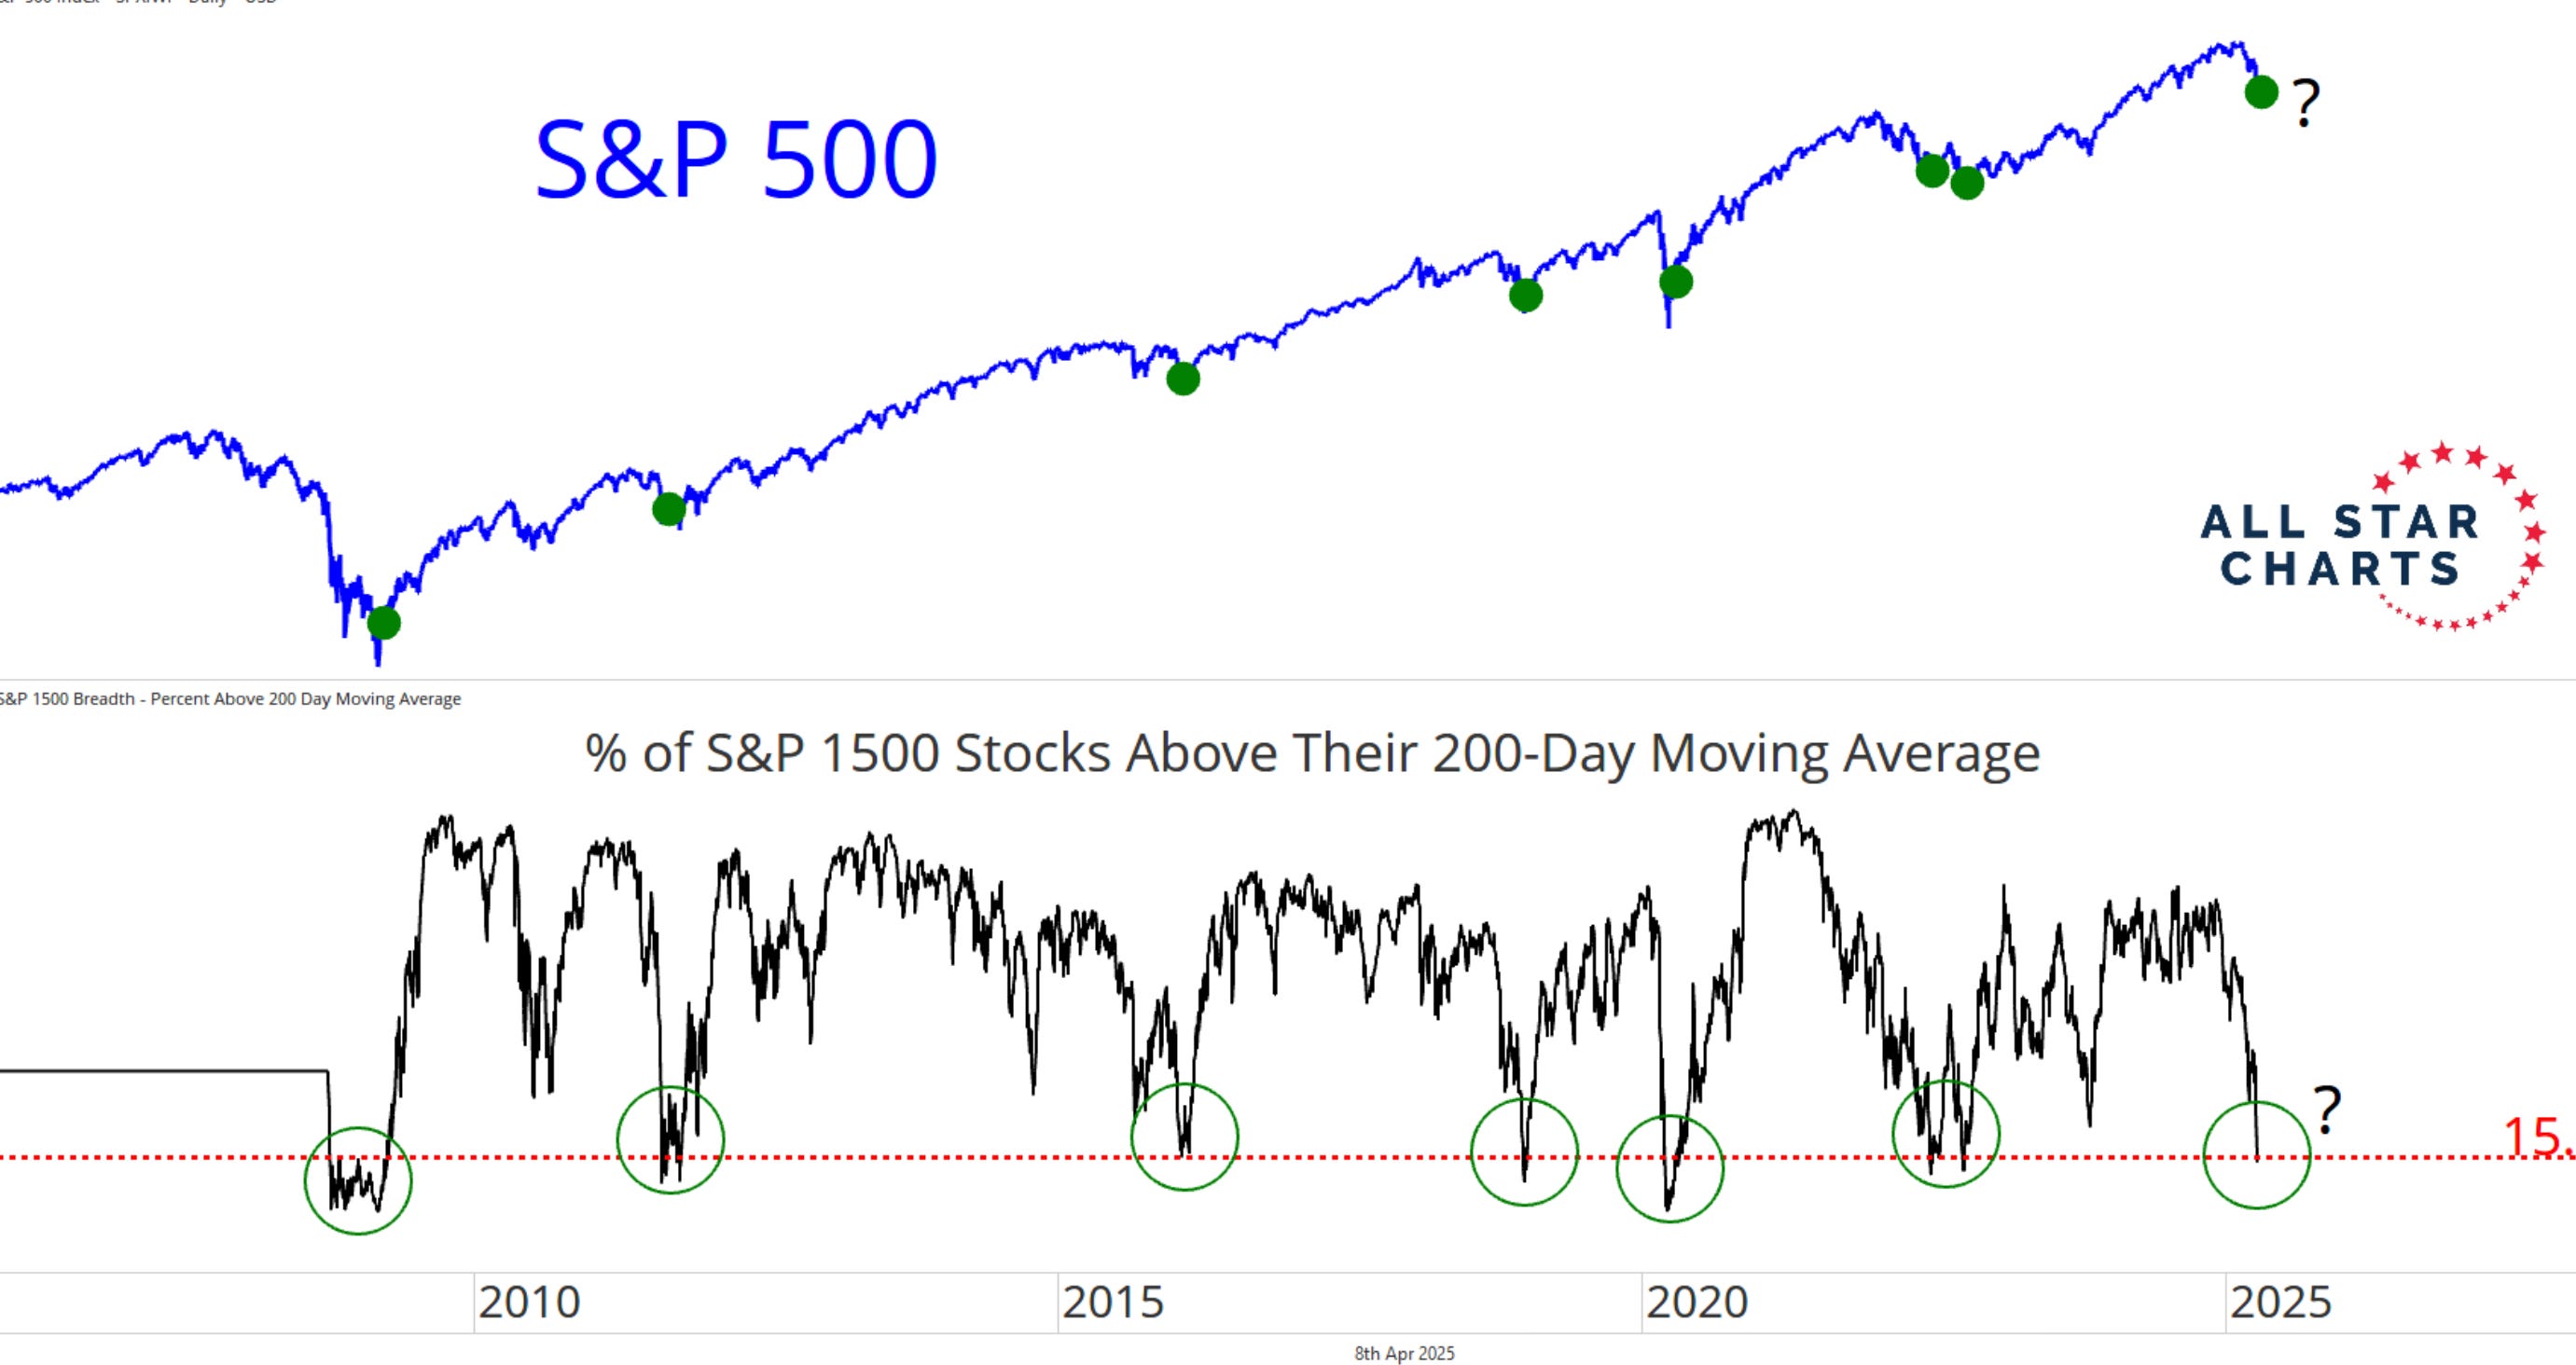
Finally! A signal that’s already been generated!
Its logic: extreme negativity followed by strong positivity means a regime change.
And yet: check out the double, sometimes triple dips in 2008, 2011, and 2022.
Those regime changes take some time before all the troops get the message, it seems.
Steven Strazza, who is a really excellent trader, even goes so far as to call this one the “signal of all signals”.
We’ll see. I’ll be watching this on a weekly basis. The Stockcharts.com symbol is $SUPA200R (which unfortunatly only goes back to 2022).
The Anchored VWAP, based on the February High
As a bare minimum, before I invested any of my own money, I’d expect the S&P 500 to penetrate a logical line. Actually, not just penetrate, but stay within a new territory, in such as way that what was formerly resistance now becomes support.
That’s what constitutes a trend change, as opposed to a flash in the pan.
A volume-weighted average price (VWAP) is the ratio of the value of a security or financial asset traded to the total volume of transactions during a trading session. With an anchored VWAP, your average price (your “anchor”) starts on a certain date that you yourself can determine.
I like to look at anchored VWAPS that begin at all-time highs. Also, those that are anchored at bear-market lows.
Looking at the orange VWAP line that is anchored to the February 2025 high, we see the market turned down every time it got close.
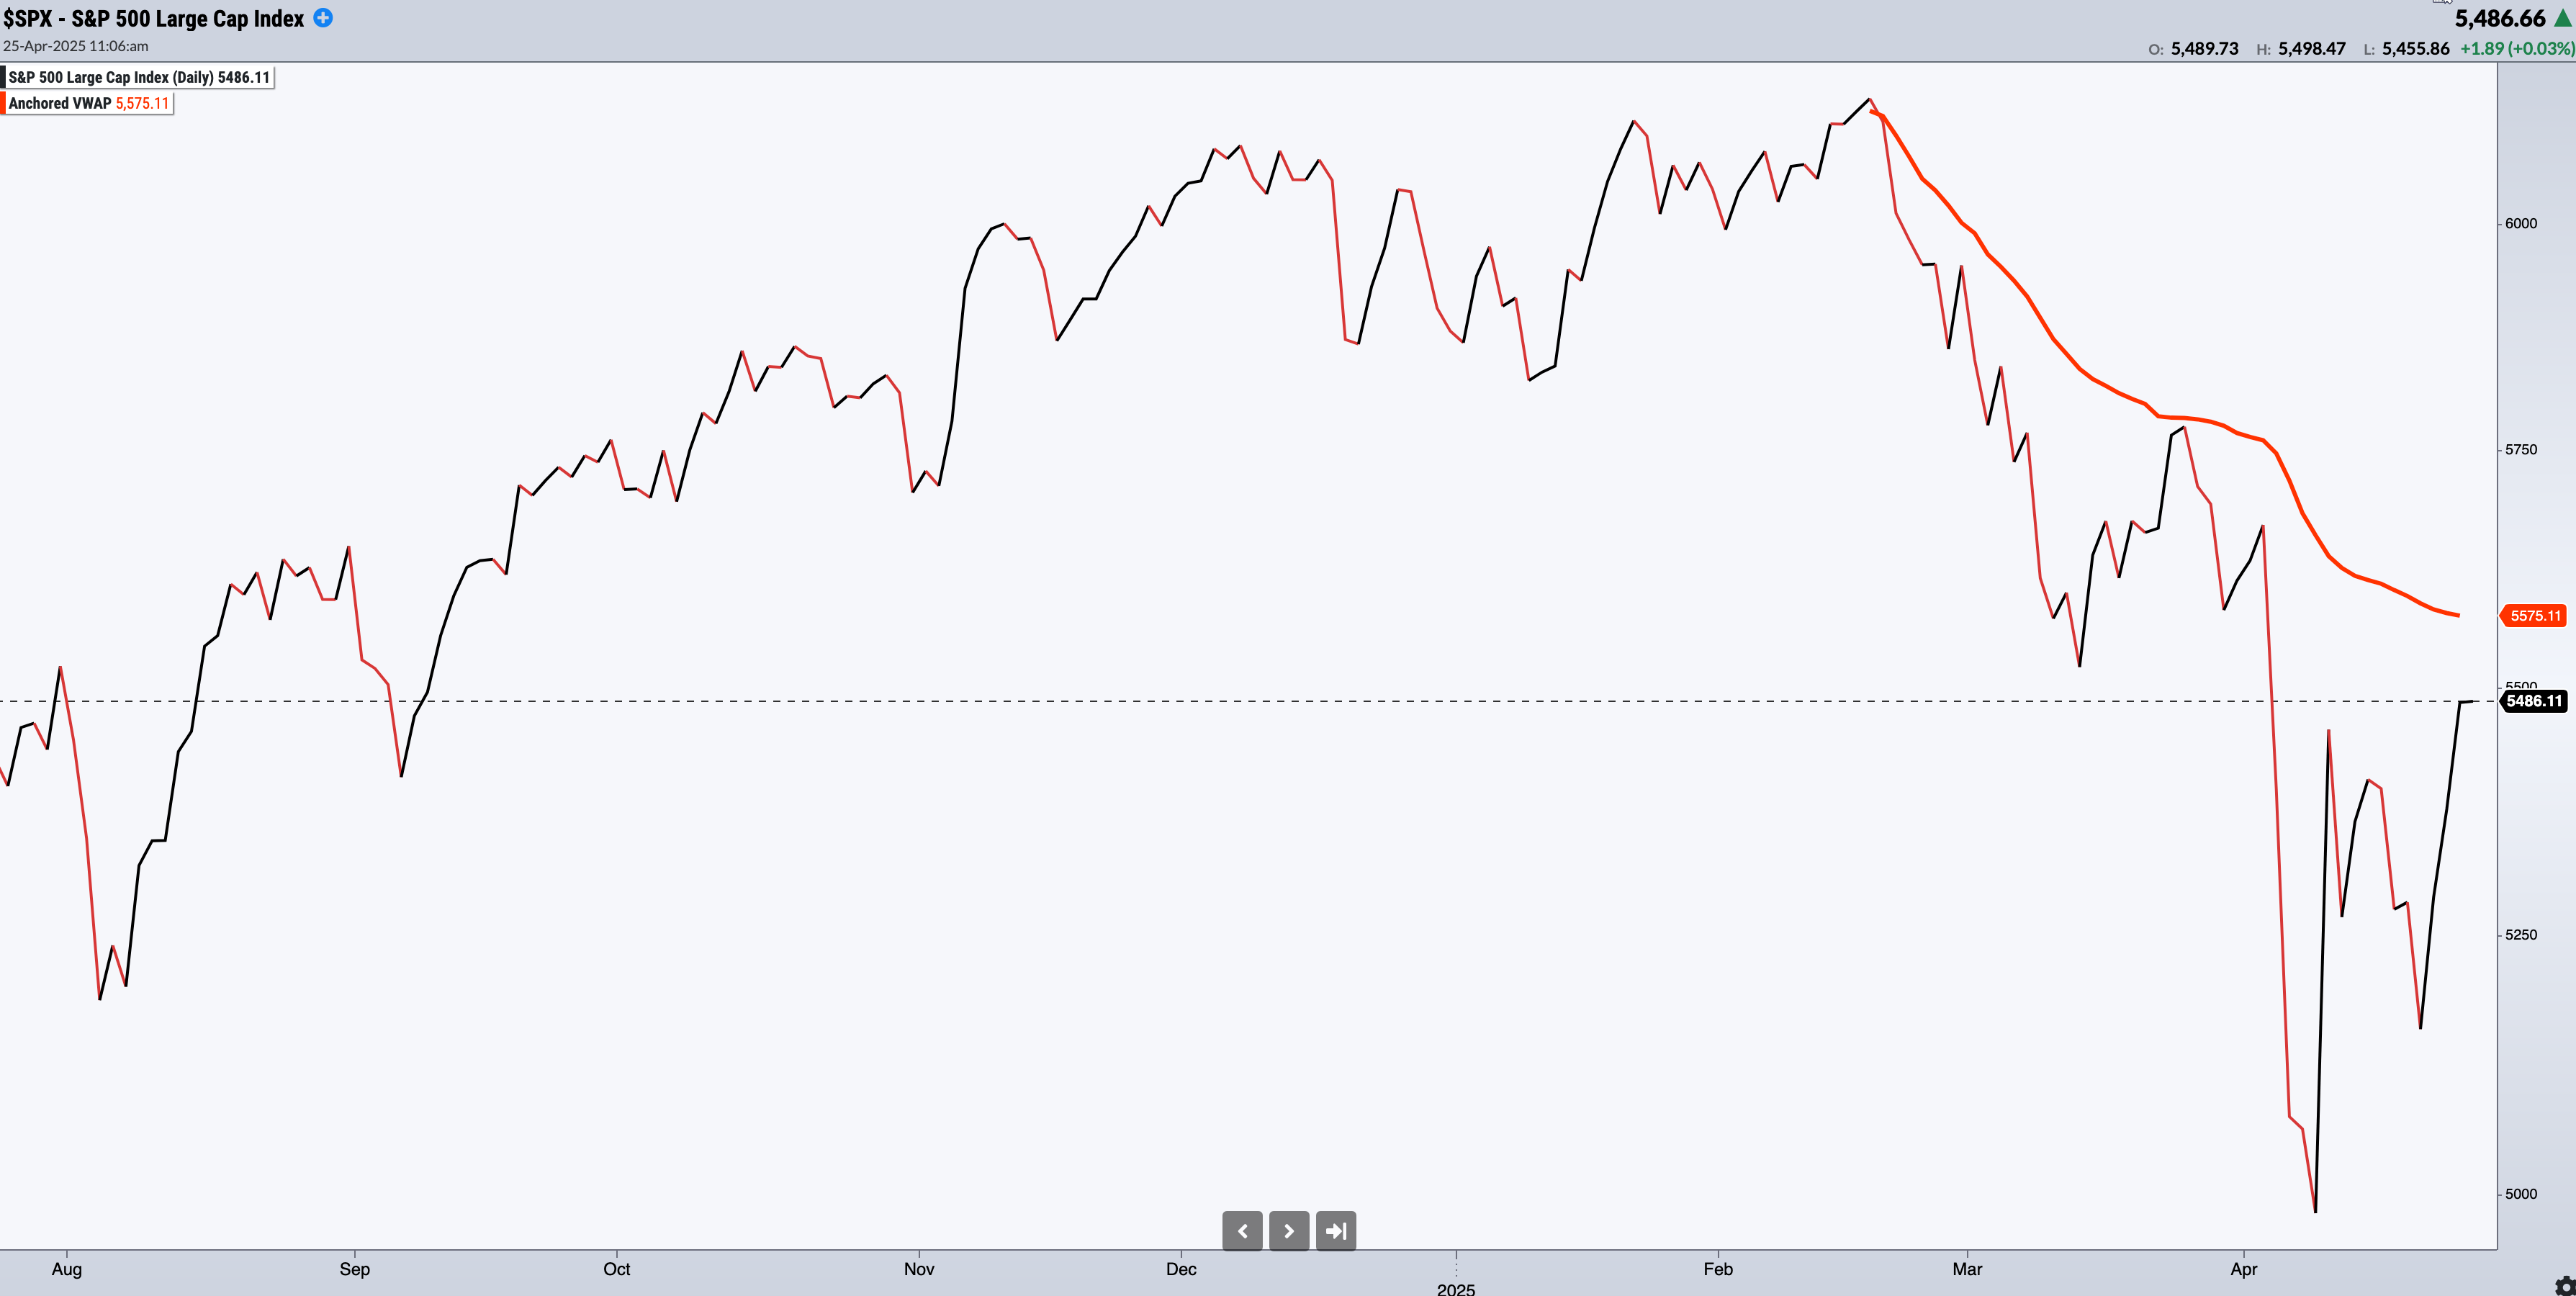
I’ll consider buying (but only shyly, with great trepidation) when we get through that orange line to the upside, and stay there. The longer, the better! Support, not resistance.
No bull markets ever began without this happening.
What about all the other signals?
The Zweig Breadth Thrust is all in the news today, as are some other ones. The seldomer they happen, the bigger the headlines.
Why is that, actually? Is N=5 somehow better than N=30? I guess it makes better headlines to write, “A super-rare signal that only occurs every 15 years says a new bear is starting right now!”
What’s your personal favorite? What am I missing? Let me know in the comments, please. Thanks for reading!
Thanks for sharing your excellent analysis Martin!
I agree that Mickey Mouse would be a better president than the current US administration. Thankfully, there are plenty of countries which are not run by the PayPal mafia proxies (Musk funded Trump's campaign and Thiel funded Vance's).
My investing approach is not to go "all in" or "all out" based in signals, but to raise or lower my "risk on" allocation depending on valuations, momentum and volatility. I tried using monthly volatility signals during the Donald's first term, but the strategy kept getting whipsawed when he would declare on-again/off-again tariffs, and it almost looked like market manipulation.
So this time I got mostly out of US equities when valuations peaked a couple of months ago, but still have some US market exposure through global funds like ACWV and multi-asset funds like GDE, and a small allocation to some factor funds. Europe-centric funds like EFAV and EUFN are doing great year to date. A lot of people gave up on funds using the low volatility factor when the tech stocks outperformed during the COVID era, but low volatility funds are outperforming their benchmarks so far this year: https://stockcharts.com/freecharts/perf.php?SPY,USMV,ACWI,ACWV,EFA,EFAV&p=4&O=011000
I don't think the US stock market will have good risk-adjusted returns until we get regime change, and I don't want to play the game of guessing whether the next post on Truth Social will drive the market up or down. But that's okay, there are still plenty of reasonable opportunities around the world.
Good luck, and please keep us posted on your models' signals!
Nice summary of multiple important signals - thanks!