
Harry Browne, You've Had a Lovely Quarter
Harry Browne, You've Had a Lovely Quarter
...well, not exactly lovely, but still worth a close look.

Please excuse my misuse of that 1960’s hit. Harry Browne, as I am sure you know, was a libertarian Presidential candidate, best-selling book author, and inventor of one of the world’s simplest investing systems he named The Permanent Portfolio.
Which says: Forget all the sophisticated strategies you might know, as they are destined to blow up sooner or later. Don’t try to out-think the market, and don’t try to time it.
Just permanently own four basic assets, for four seasons of investing:
Stocks, for years of prosperity with low inflation and low unemployment.
Bonds, for times of prosperity that are also deflationary.
Gold, which does very well during times of inflation.
Cash or short-term treasuries, as a safe haven, when everything else is going to hell. It is a liquid asset that gives you purchasing power when your income and investments may be ailing.
Rebalance each of these assets once a year to ratio the balance of 25% each. This probably takes less than ten minutes: presto, a fail-safe, fool-safe, crisis-safe, easy way of investing.
Long-term results are quite stable. According to his book, “Fail-Safe Investing”, this strategy in the 29 years from 1970 to 1989 provided an annual gain of 9.9% per year, which was 4.5% per year above inflation. The portfolio lost value in only three of these 29 years.
We can backtest the Permanent Portfolio using mutual funds from 1992 onwards, and during that time, it had only five negative years. Its CAGR to end-April 2022 was 6.98%; the maximum monthly drawdown was -13.06%.
Just staying invested in the S&P 500 was more profitable, attaining 9.91%, but with crazy-higher drawdowns, at a maximum of -50.97%.

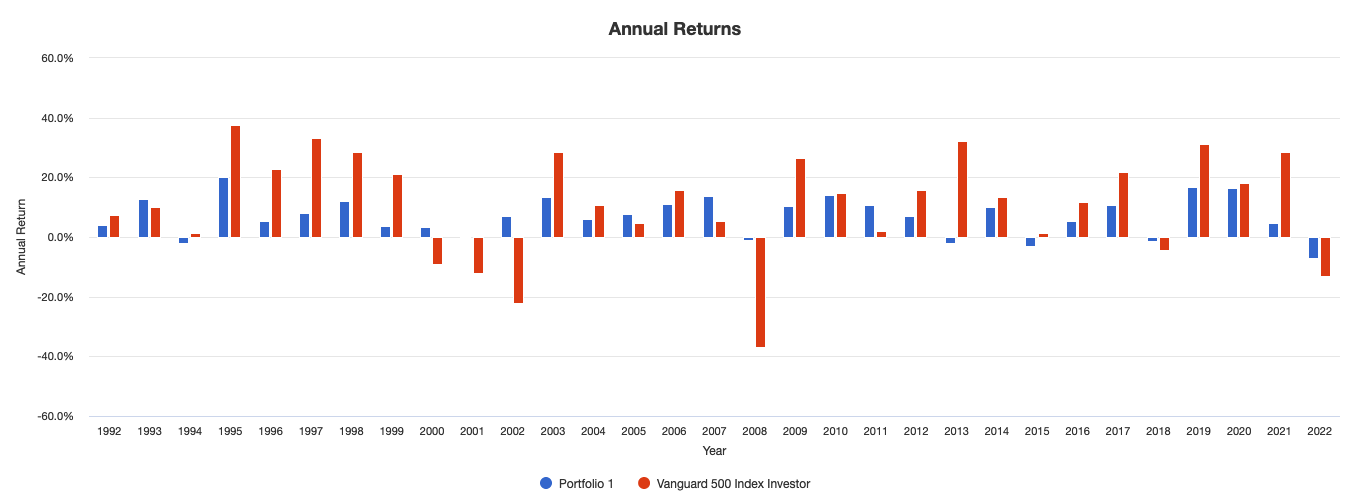
The PP’s ratio of return to drawdown (the so-called MAR) may not look exceptional, but please note that apart from the infamous Great Financial Crisis of 2008, all of its other drawdown phases were considerably less harmful — never worse than -7.61%. That’s not bad for a strategy that only rebalances once a year.
I really like how the present year 2022 is not much more than a blip on the drawdown screen, in contrast to so many strategies that rely on trend-following, market timing, or the classic 60/40 stocks/bonds split. Many or most of those are suffering record-breaking drawdowns because your usual counterweight (bonds) is kaput this year. Not so for the PP!
In comparison to the S&P 500, the PP has survived 2022 (which apparently is the worst year for stocks since 1939!) relatively unscathed: -7.13% in comparison to the S&P 500’s -12.96%
Contrary to trend-following strategies which try to identify what is working well right now, the PP always has around 75% of your assets invested in hedges. So even if an out-of-the-blue crash such as in 1987 occurred, you’ll be relatively secure. (Substituting the short-term treasuries for cash allows you to test the PP from 1987 onwards, and indeed, that year turned out quite positive, gaining +8.06%.)
(Addendum May 16: I had forgotten how Portfoliovisualizer enables longer backtests when you use generic asset classes. With 25% each US stock market/10-year treasuries/cash/gold we can now include data from the stagflation years, and get from 1972 to end-April 2022 a CAGR of +8.27%, a max drawdown of 13.19%. Of these almost 50 years only 7 were negative, the worst at -4.05%, all others better than -3%.)
An attempt to improve the Permanent Portfolio’s performance
I added a 4% stop-loss threshold, and now CAGR is slightly higher than the maximum monthly drawdown. Since 1992, only four years ended (slightly) negative, and our suffering during the present year is reduced to -1.82%.
Beware that this method means looking at your algorithm on a regular, sometimes daily basis — the opposite of the very relaxed annual schedule of Harry Browne’s original.
And an attempt to add leverage
Not everybody will be content with 6.76% per year, especially when inflation is taken into consideration. I tried a number of ways to up returns while keeping risk in check. Long story short, no results were anything close to spectacular. But at least this 25/25/35/15 combo of UPRO/TYD/UGL and cash, rebalanced annually, squeezes out a risk-return ratio (aka MAR) of 0.88.
CAGR since 2010: 13.06%; maximum monthly drawdown -14.72%. Look for these numbers to deteriorate if May turns out to be another bummer month…
So, in sum, does it work for me?
If I was worth, say, three million or so, the idea of investing it according to the sleep-well principles of Harry Browne would be very seductive indeed. But generally, a return of less than 7% (or in the case of 2021, less than 2%) is not quite my cup of tea. Famous last words!
And how do you feel about the concept of a Permanent Portfolio? And do you have any ideas on how to boost returns, without totally negating the principles behind the PP? Let me know in the comments, please!
Addendum May 16:
I had forgotten how Portfoliovisualizer enables longer backtests when you use generic asset classes. With 25% each US stock market/10-year treasuries/cash/gold we can now include data from the stagflation years, and get from 1972 to end-April 2022 a CAGR of +8.27%, and a max drawdown of 13.19%. Of these almost 50 years only 7 were negative, the worst at -4.05%, all others better than -3%.
Link in the article.
Not the Permanent Portfolio but maybe something of interest.
https://tinyurl.com/ynks837p